

TL;DR
Polycab India’s total expenses jumped about 29.68% YoY to ₹ 7,875.6 crore in Q4 FY 26. It is largely due to higher operating costs and an unfavorable product mix inclined towards institutional sales. This resulted in compressed EBITDA margins from 14.7% to 13.1%.
Introduction
Polycab India Limited is India’s largest wire and cables manufacturer. They reported a strong top-line performance in Q4 FY 26, but investors are closely watching rising expenses and margin pressure.
The company’s expenses surged more than 29% YoY while EBITDA margins contracted by 160 basis points, even as revenue and profit both grew. This mix is shaping a narrative around Polycab share price and how the stock is likely to trade going forward.
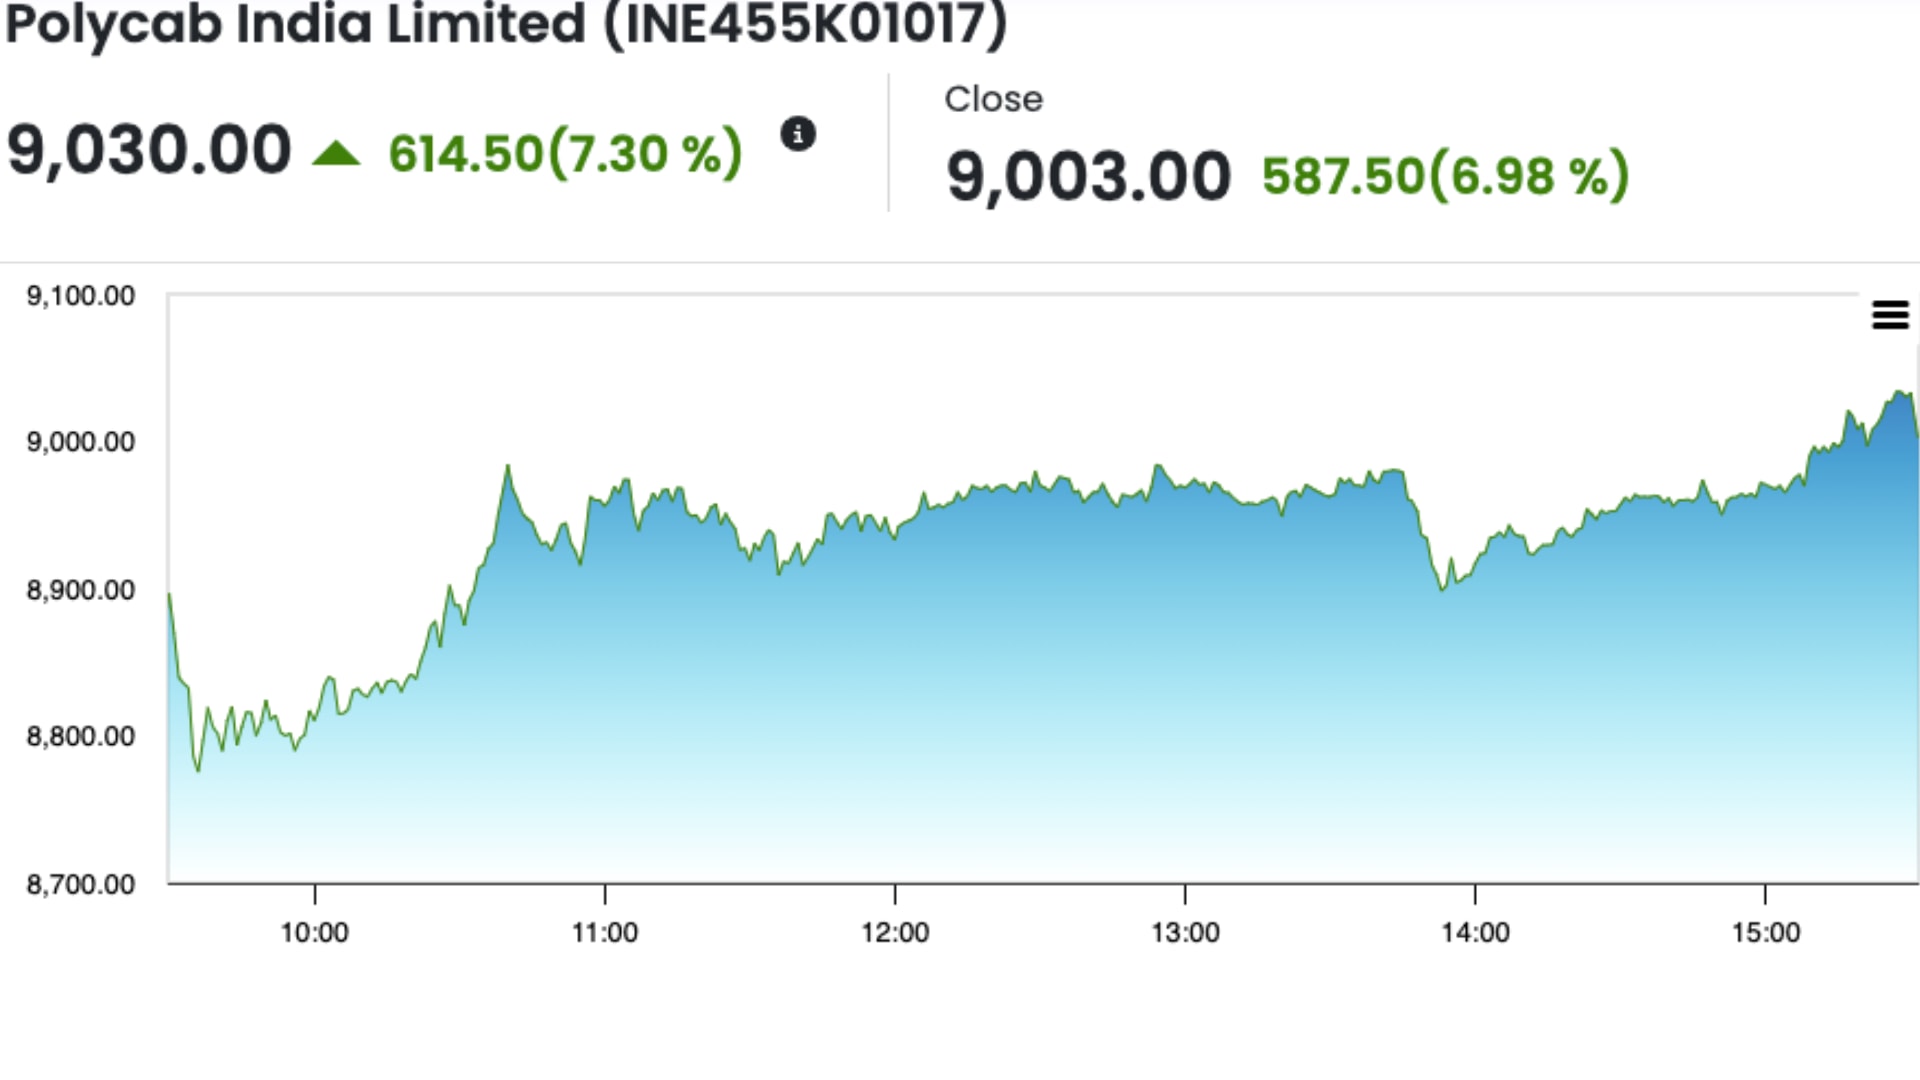
Polycab Share Price
Source: NSE
Quarter 4 FY 26 : Key Financials of Polycab Limited at a Glance
Metric | Q4 FY 26 Value | YoY Change/Comparison |
Revenue | ₹8,864.4 crore | Up 27% YoY from ₹6,986 crore |
Expenses | ₹7,875.6 crore | Up 29.68% YoY from ₹6,073.31 crore |
EBITDA | ₹1,161 crore | Up 13.3% YoY from ₹1,025 crore |
Profit after tax (PAT) | ₹785.6 crore | Up 7% YoY |
Dividend | Final dividend of ₹47 per share | Payout ratio 27.2% vs 26.3% in FY25‑26 |
Why did Polycab Expenses Jump Over 29%?
Under Polycab's management, it was established that the sudden rise in the expenses is due to nothing but higher input costs, operating deleverage, and a shift in product mix toward institutional-oriented sales, which are relatively lower-margin but volume driven.
1. Unfavourable Product Mix:
As the major factor, the institutional channels to include OEMs, builders, government/infrastructure contributed to a large share of sales. But usually, these carry lower margins in comparison to that of retail-driven consumer products.
2. Operating Deleverage:
As the company ramps up capacity and distribution, fixed cost absorption becomes less efficient in the near term, pressurising operating margins even when sales grow.
3. Project Spring and Solar Push:
Polycab India is investing in solar-related products under the “Project Spring”. They are expanding the market share , which involves higher upfront spends on marketing, R&D, and brand building.
These factors together explain why expenses grew faster than revenue 29% Vs 27%. (Source: IANSLIVE)
How Did Polycab’s Margins Change?
Despite the top-line growth, Polycab’s EBITDA margin for Polycab fell by 160 basis points. It reduced to 13.1% in Q4 FY 26, from 14.7% in Q4 FY 25.
EBITDA Margin: 13.1% vs 14.7% (down 160 bps, but still 13% plus range)
PAT Growth Vs Margin Growth: PAT grew 7% despite this margin compression, implying the scale and volume are more than compensating for margin pressure in the short term. (Source: The Hindu BL)
For Polycab share price, investors care about both the absolute profit number and margin trajectory. For the growth oriented investments, a temporary dip is often viewed positively by the market if the market share outlook remains intact.
Segment Wise Performance- Polycab Limited
Polycab’s Q4 growth was primarily contributed by its core Wires and Cables. And the latest Fast-Moving Electrical Goods (FMCG) segment also added to the growth. But on the other hand, (Engineering, Procurement, and Construction) business saw a slowdown.
1. Wires and Cables:
The revenue saw a growth of ~30% YoY, driven by strong domestic housing and infrastructure demand and continued market-share gains. This segment remains the profit engine and supports the polycab share price. (Source: IANSLIVE)
2. FMEG:
The segment including solar products saw a 47% YoY nearly doubling and becoming the largest sub-category within FMEG. Management is targeting 8-10% EBITDA margins by FY 30 here, implying a gradual improvement from current levels.
3. EPC Segment:
It saw a ~15% YoY down on revenue due to project-execution delays and timing issues. This is a small portion of the business, so the impact on the group earnings has been limited.
What Does This Mean for Polycab Share Price?
Post-results, Polycab share price has generally trended higher, helped by the record revenue and profit growth, even though margins squeezed.
As of recent price action, polycab’s stock has delivered over 40% returns in the last 12 months, outperforming the broader Sensex unexpectedly.
The stock trades at a high P/E multiple and is often described as “premium-valued” given the market leadership of the brand.
Looks, for the long-term investors, Polycab share price is likely to respond more to sustained revenue growth, margin stabilisation, and market share gains.
Conclusion
Polycab India’s Q4 results showed that growth is not free; as the expenses jumped 29% and margins compressed by about 160 bps. The market is still balancing short-term margin pressure with long-term growth story. And this is the reason Polycab share price remains an uptrend despite the premium valuation.
FAQs
Why did Polycab’s expenses jump over 29% in quarter 4?
The expenses grew mainly due to higher input costs, shift towards lower margins, institutional channel sales, and operating deleverage.
Did Polycab’s profit still grow despite higher expenses?
Yes, PAT rose 7% YoY to ₹785.6 crore. The growth indicates volume growth and sales are compensating for margin pressure in the near term.
What is “Project Spring” for Polycab Limited?
“Project Spring” is a strategic initiative to expand market share especially in solar-related FMEG and other categories.