

Stockify Logo
About
Unlisted Share Price
Buy
Call
Add as a preferred source on Google
Stockify Logo

26, 1st Floor, 16th Cross Road, 18th Main Rd, J P Nagar Phase 5, J. P. Nagar, Bengaluru, Karnataka 560078

+91 80414 37692contact@stockifyfintech.com

QUICK LINKS

  • NSE
  • BSE
  • MSEI
  • NCDEX
  • NSDL Login
  • CDSL Login
  • MCX
  • Smart ODR

RESOURCES

  • About Us
  • All Unlisted Shares
  • Corporate Profile
  • News
  • Blog
  • Annual Reports
  • FAQ

RESOURCES

  • Connect
  • Become A Partner
  • Become A Contributor
  • DRHP Filed
  • Off-Market Annexures
  • Reviews
  • Investor Relations

UPCOMING IPO

  • Draft Offer Filed With SEBI
  • Red Herring Filed With ROC
  • Final Offer Filed With ROC
  • Other

Investment
Calculators

Powerful tools to plan your investments and financial future.

Investment Planning

  • SIP Calculator
  • Lumpsum Calculator
  • SWP Calculator
  • Goal SIP Calculator
  • Retirement Calculator

Loans & EMI

  • Home Loan EMI Calculator
  • Car Loan EMI Calculator
  • Personal Loan EMI Calculator
  • Education Loan EMI Calculator
  • Business Loan EMI Calculator

Financial Planning

  • PPF Calculator
  • EPF Calculator
  • NPS Calculator
  • Mutual Fund Calculator
  • FD Calculator

Tax & Savings

  • Income Tax Calculator
  • GST Calculator
  • TDS Calculator
  • XIRR Calculator
  • EPF Withdrawal Calculator

Other Calculators

  • Inflation Calculator
  • Step Up SIP Calculator
  • Compound Interest Calculator
  • CAGR Calculator
  • Stock Average Calculator

© 2026 Stockify · stockify.net.in · All rights reserved

PrivacyTermsDisclaimer

Disclaimer: Investment in unlisted shares carries a high level of risk. The logic for investment in unlisted shares is different from listed shares. Please consult your financial advisor before investing. Stockify is a platform to facilitate buying and selling of unlisted shares. Past performance does not guarantee future returns. Stockify is not a SEBI-registered stockbroker.

JOIN
Lupin Q4 Results: Profit Soars 90%, Revenue Nears... | Stockify
Lupin Q4 Results: Profit Soars 90%, Revenue Nears Rs 7,500 Crore; Highest-Ever Dividend Declared
Finance

Lupin Q4 Results: Profit Soars 90%, Revenue Nears Rs 7,500 Crore; Highest-Ever Dividend Declared

Lupin Q4 FY2026 results: profit up ~90%, revenue nears ₹7,500 crore, highest-ever ₹18 per share dividend; and impact on Lupin share price explained.

Shweta Sharma
Shweta Sharma
5 min read
May 8, 2026
Home›Blog›Lupin Q4 Results: Profit Soars 90%, Revenue Nears Rs 7,500 Crore; Highest-Ever Dividend Declared

TL;DR

Lupin posted Q4 FY 26 revenue of about ₹7,475 crore, up 31.9% YoY with PAT soaring ~89-90% to roughly ₹1470 crore. It is driven primarily by strong U.S. and emerging markets sales and expanded EBITDA by 35%.

About Lupin Limited

Lupin Limited was founded in 1968, the company works across generics branded formulations, APIs, biotech and consumer healthcare. It is a Mumbai-based global pharmaceutical company that sells its product in over 100 countries. Lupin has strong exposure to India, the U.S. and other emerging markets. 

Lupin trades on both BSE (NSE: LUPIN, BSE: 500257) and is consistently counted among the top 5-10 pharma players by prescription share in the U.S. and among the top 10 Indian pharma companies by market share.

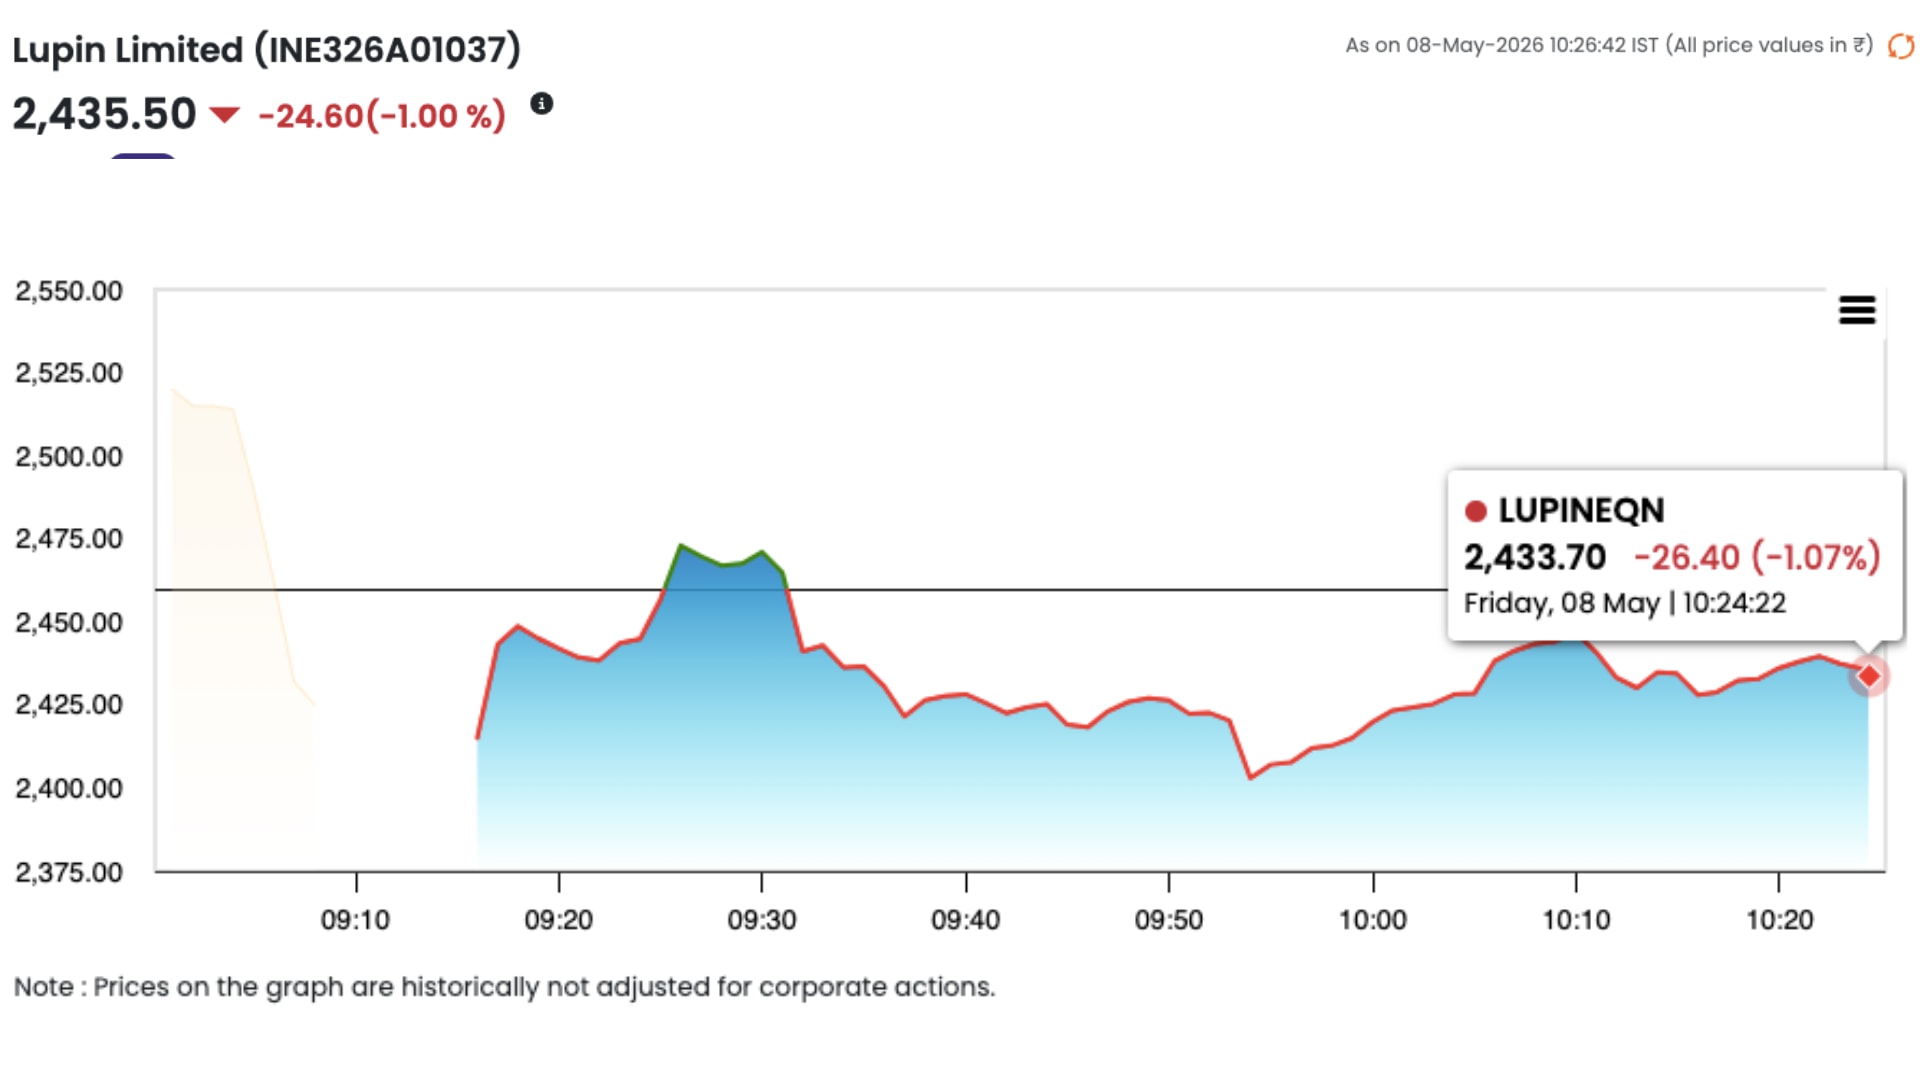
Lupin Share Price
Uploaded image

Source: NSE 

Lupin Q4 FY 2026 Earnings: The Big Picture

Metric

Value 

YoY Change

Notes

Consolidated Revenue

7,474.7

+31.9%

Up from ₹5,667.1 crore in Q4 FY2025. 

Profit After Tax (PAT)

1,468.7

+87.7%

Up from ₹782.4 crore in Q4 FY2025; often rounded to “up ~90%” in media reports. 

EBITDA

2,626.3

+90.6%

EBITDA margin expanded to 35.5% from 24.8% in Q4 FY2025. 

These figures come from summarised financials by Rediff Money.

Key Financial Metrics (Q4 FY 2026 Vs Q4 FY 2025)

Here is a quick view of Q4FY 2026 line items taken from the Lupin-authored table. 

Source: Lupin 

Metric (₹ millions)

Q4 FY2026

Q4 FY2025

YoY change

Sales (formulations + API)

73,919

55,622

+32.9% 

Total Revenue from Operations

74,747

56,671

+31.9% 

Gross Profit (excl. other income)

55,403

38,760

+42.9% 

EBITDA

26,263

13,781

+90.6% 

EBITDA margin

35.5%

24.8%

+1,070 bps 

Profit Before Tax (PBT)

19,280

8,958

+115.2% 

Profit After Tax (PAT)

14,687

7,824

+87.7%

Profit for the period (incl. non‑controlling)

14,604

7,725

+89.0%

Source: lupin

Where is The Growth Coming From: Geographic Sales Mix

A closer look at the Q4 FY 2026 sales mix shows a strong contribution from the U.S. and emerging markets. It supports the margin expansion and profitability spike reported in the Lupin share price-linked commentary. (Source: Lupin)

  1. U.S. Region: In Q4 FY 26, there was a total revenue of ₹33,987 crore. It showed a sales growth of up 56.9% YoY, now about 46% of global sales 

  2. India Region: A total revenue ₹19,802 crore was observed, which was up 11.5% YoY, approximately 26% of global sales.

  3. Emerging Market: For these markets, a total revenue of ₹9,906 crore was registered, up 49.2% YoY around 13% of global sales.

Lupin attributes this growth to strong prescription level performance in the U.S. generics market and selective brand launches in India and the outside market.

Conclusion

Lupin’s Q Fy 2026 results paint a clear picture of a turnaround-to-growth story fully in motion: profit up by nearly 90%, revenue touching ₹7500 crore. This is all driven by U.S. generics market and improving India and emerging business markets. 

The declaration of record dividend is management’s confidence in future cash flow and its commitment to rewarding shareholders.

These results reinforce stock as large cap domestic pharma play with improving balance sheets. The investors need to watch sustained margin performance, competitive dynamics in the U.S., and how does the execution in emerging markets including India.

FAQs

How much is the total profit and revenue registered in Q4 FY 26 for Lupin?

Lupin reported a consolidated revenue of ₹7,474.7 crore. This is about 31.9% up YoY. Other than this, a PAT of ₹1,468.7 crore in Q4 FY 2026.

Where can I quickly verify or check quarterly results of Lupin?

You can check the official figures at Lupin’s website here.

What is Lupin’s share price and where is it listed?

Lupin is listed on NSE as LUPIN and 500257 on the BSE.  The data shows the stock price is ₹2,300-₹2,400 band.

Why is Lupin’s dividend the highest ever?

Lupin’s FY 26 profit after tax jumped over 60% YoY to ₹53,555 crore with Q4 PAT up ~87-90% . Other than this, EBITDA margins extended sharply to the mid 30% range, improving operating cash generation. The board’s confidence of 900% at ₹18 dividend is framed as a shareholder friendly signal that management is confident about profitability and cash flow.

Related Articles

ITC Share Price Near 52-Week Low: Slips 8% in 1 Month, Down 21% in 2026- What's Dragging the Stock?
May 30, 2026

ITC Share Price Near 52-Week Low: Slips 8% in 1 Month, Down 21% in 2026- What's Dragging the Stock?

Shweta Sharma
Shweta Sharma
Read →
Wipro Shares Jump Nearly 5%; What Shareholders Need to Know Today
May 29, 2026

Wipro Shares Jump Nearly 5%; What Shareholders Need to Know Today

Shweta Sharma
Shweta Sharma
Read →
SBI Mutual Fund IPO Roadshow  Begins: Know IPO Details
May 29, 2026

SBI Mutual Fund IPO Roadshow Begins: Know IPO Details

Piyush Jhunjhunwala
Piyush Jhunjhunwala
Read →
Shweta Sharma

Shweta Sharma

I am Shweta Sharma, a seasoned content writer with over 12 years of experience, including expertise developed prior to the rise of AI-driven tools. My primary focus has been in the finance domain, where I specialize in creating clear, intent-driven content that delivers real value to users.

⚠️

Disclaimer: Investment in unlisted shares carries a high level of risk. The logic for investment in unlisted shares is different from listed shares. Please consult your financial advisor before investing. Stockify is a platform to facilitate buying and selling of unlisted shares.

Share:
Analyze with AI:
ChatGPT
Perplexity
Claude
Gemini
Grok

Table of Contents

01TL;DR02About Lupin Limited03Lupin Q4 FY 2026 Earnings: The Big Picture04Key Financial Metrics (Q4 FY 2026 Vs Q4 FY 2025)05Where is The Growth Coming From: Geographic Sales Mix06Conclusion07FAQs

Invest in Unlisted Shares

Get exclusive access to pre-IPO stocks. Fill the form to get our latest price list.