National E-Repository Limited Unlisted Shares
About The Company
Strong
Market Position
Consistent
YoY Growth
Experienced
Management
Key Indicators
A snapshot of National E-Repository Limited Unlisted Shares's financial health, valuation multiples and capital efficiency at a glance.
Pricing Trends
Financial Performance
| Indicators | 2025 | 2024 | 2023 | 2022 | 2021 | 2020 | 2019 | 2018 |
|---|---|---|---|---|---|---|---|---|
| Revenue | 12.0 | 10.8 | 9.6 | 12.0 | 7.9 | 9.5 | 11.6 | 6.8 |
| Expense | 15.2 | 13.6 | 11.8 | 9.9 | 9.9 | 10.4 | 8.3 | 4.8 |
| EBITDA | -3.2 | -2.7 | -2.2 | 2.0 | -2.0 | -0.9 | 3.2 | 2.0 |
| Other Cost | 2.1 | 4.0 | 5.1 | 5.7 | 5.3 | 6.4 | 6.0 | 2.9 |
| PBT | -5.3 | -6.7 | -7.3 | -3.6 | -7.3 | -7.3 | -2.8 | -0.9 |
| Tax Expense | -1.3 | -1.7 | -1.8 | -0.9 | -1.8 | -2.7 | -0.7 | -0.1 |
| PAT | -4.0 | -5.0 | -5.5 | -2.7 | -5.5 | -4.6 | -2.1 | -0.8 |
| Other Inc./Exp. | -0.2 | 0.0 | 0.0 | 0.0 | 0.0 | 0.0 | 0.0 | 0.0 |
| Net Income | -4.1 | -5.0 | -5.5 | -2.7 | -5.5 | -4.6 | -2.1 | -0.8 |
| Shares O/S | 8.10 | 8.10 | 8.10 | 8.10 | 8.10 | 8.10 | 8.10 | 8.10 |
| EPS (₹) | -0.49 | -0.60 | -0.70 | -0.30 | -0.70 | -0.60 | -0.30 | -0.10 |
| Rev. Growth % | 11.1% | 12.5% | -20.0% | 51.9% | -16.8% | -18.1% | 70.6% | — |
| EBITDA Mgn % | -26.7% | -25.0% | -22.9% | 16.7% | -25.3% | -9.5% | 27.6% | 29.4% |
| Net Mgn % | -34.2% | -46.3% | -57.3% | -22.5% | -69.6% | -48.4% | -18.1% | -11.8% |
| EPS Growth | -18.3% | -14.3% | 133.3% | -57.1% | 16.7% | 100.0% | 200.0% | — |
Registered Address
Management Team
Download Financial Results
In The News


From The Experts


Top Unlisted companies


Frequently Asked Questions
Still have questions?
Our expert team typically responds within 30 minutes during market hours.
National E-Repository Limited Unlisted Shares Unlisted Shares
About National E Repository Limited Shares
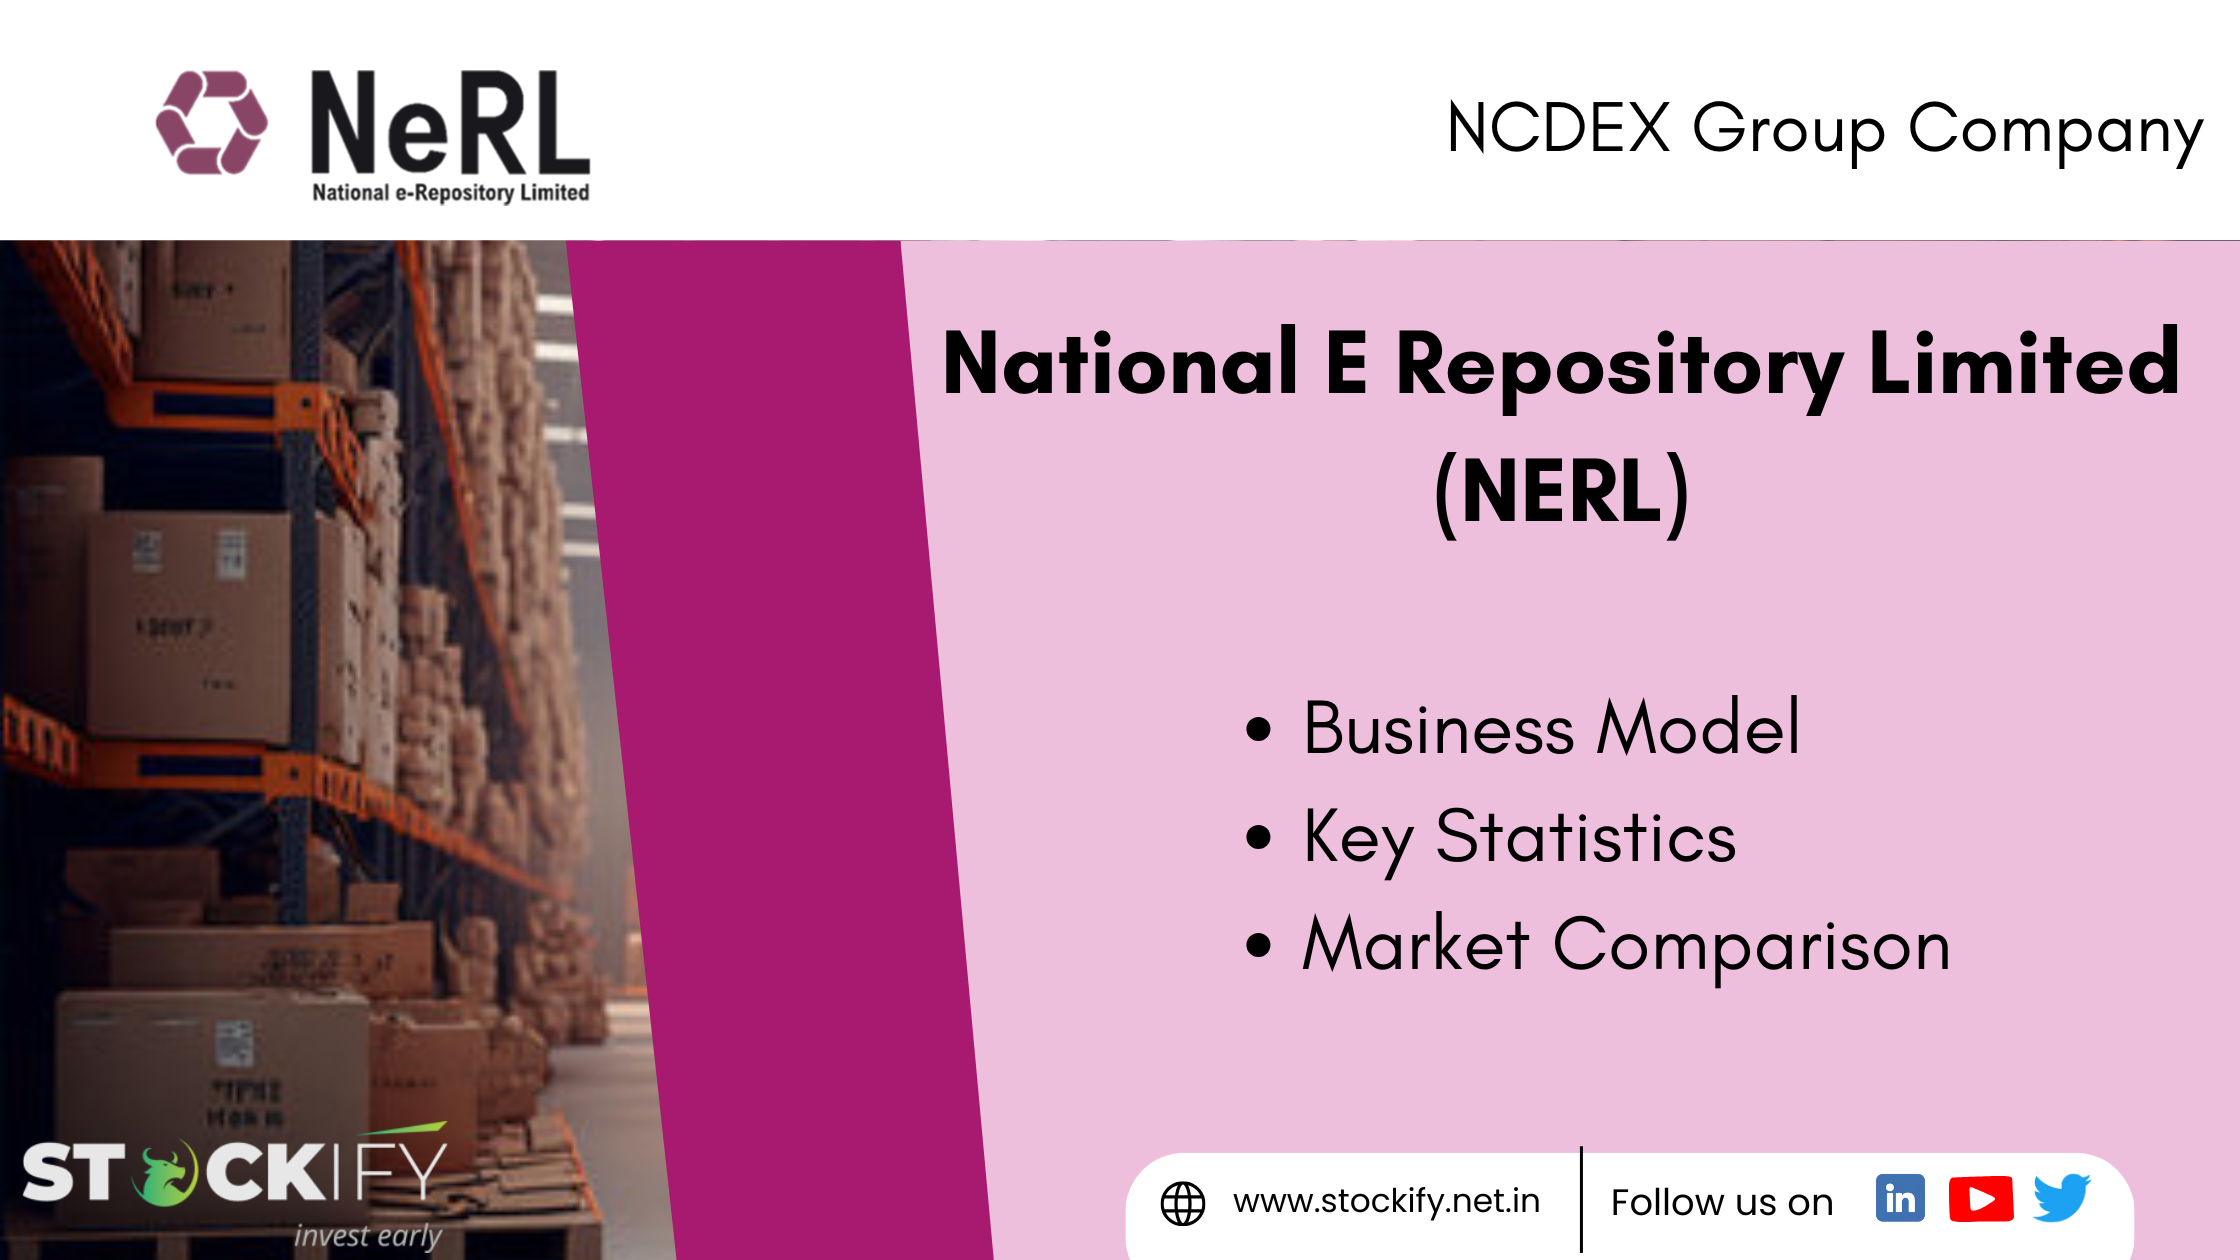
National Commodity & Derivatives Exchange Limited (NCDEX), the largest Agri Commodity Derivatives Exchange, has incorporated an institution and a market intermediary, National E-Repository Limited(NERL)
NERL provides a platform for issuing electronic negotiable warehouse receipts for commodities.
NERL's main business is offering a digital platform for creating and managing Electronic Negotiable Warehouse Receipts(eNWRs) issued in warehouses registered with the WDRA.
Business Model of NERL
A) NERL's main business is offering a digital platform for creating and managing eNWRs issued in warehouses registered with the WDRA.
B) In India, EWRs (specifically called "Electronic Negotiable Warehouse Receipts" or eNWRs) are mandatory for all registered warehouses.
C) Effective from 1st August 2019, the Warehousing Development and Regulatory Authority (WDRA) guidelines require the issue of warehouse receipts electronically.
D) With coverage across 15+ states & 11k+ clients, NeRL has a market leadership in terms of warehouses and issuance of eNWRs and highly prominent and reputable key shareholders. Thus signaling huge growth potential.
The Company does not have any Subsidiary, Joint Venture, or Associate Company.
What are the benefits of E Warehouse Receipts?
Centralized online recordkeeping.
Connectivity to commodity exchanges.
Fiduciary trust is regulated by the WDRA Act.
Access to Institutional Finance with Lower Interest Rates.
No additional cost for collateral monitoring and surveillance.
Key Shareholders in NERL
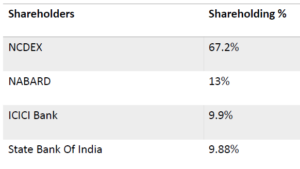
Key Achievements
Coverage in 15+ states, 11k+ clients, market leadership in warehouses and issuance of eNWRs, dynamic leadership team, and highly prominent and reputable key shareholders.
As of FY24, NeRL has achieved a pledge volume of over 7000 Cr, issued electronic warehouse receipts worth 6300 Cr, and onboarded 76 banks as pledgees.
NeRL currently has 138 accredited warehouses with the potential to manage ten times the current volume.
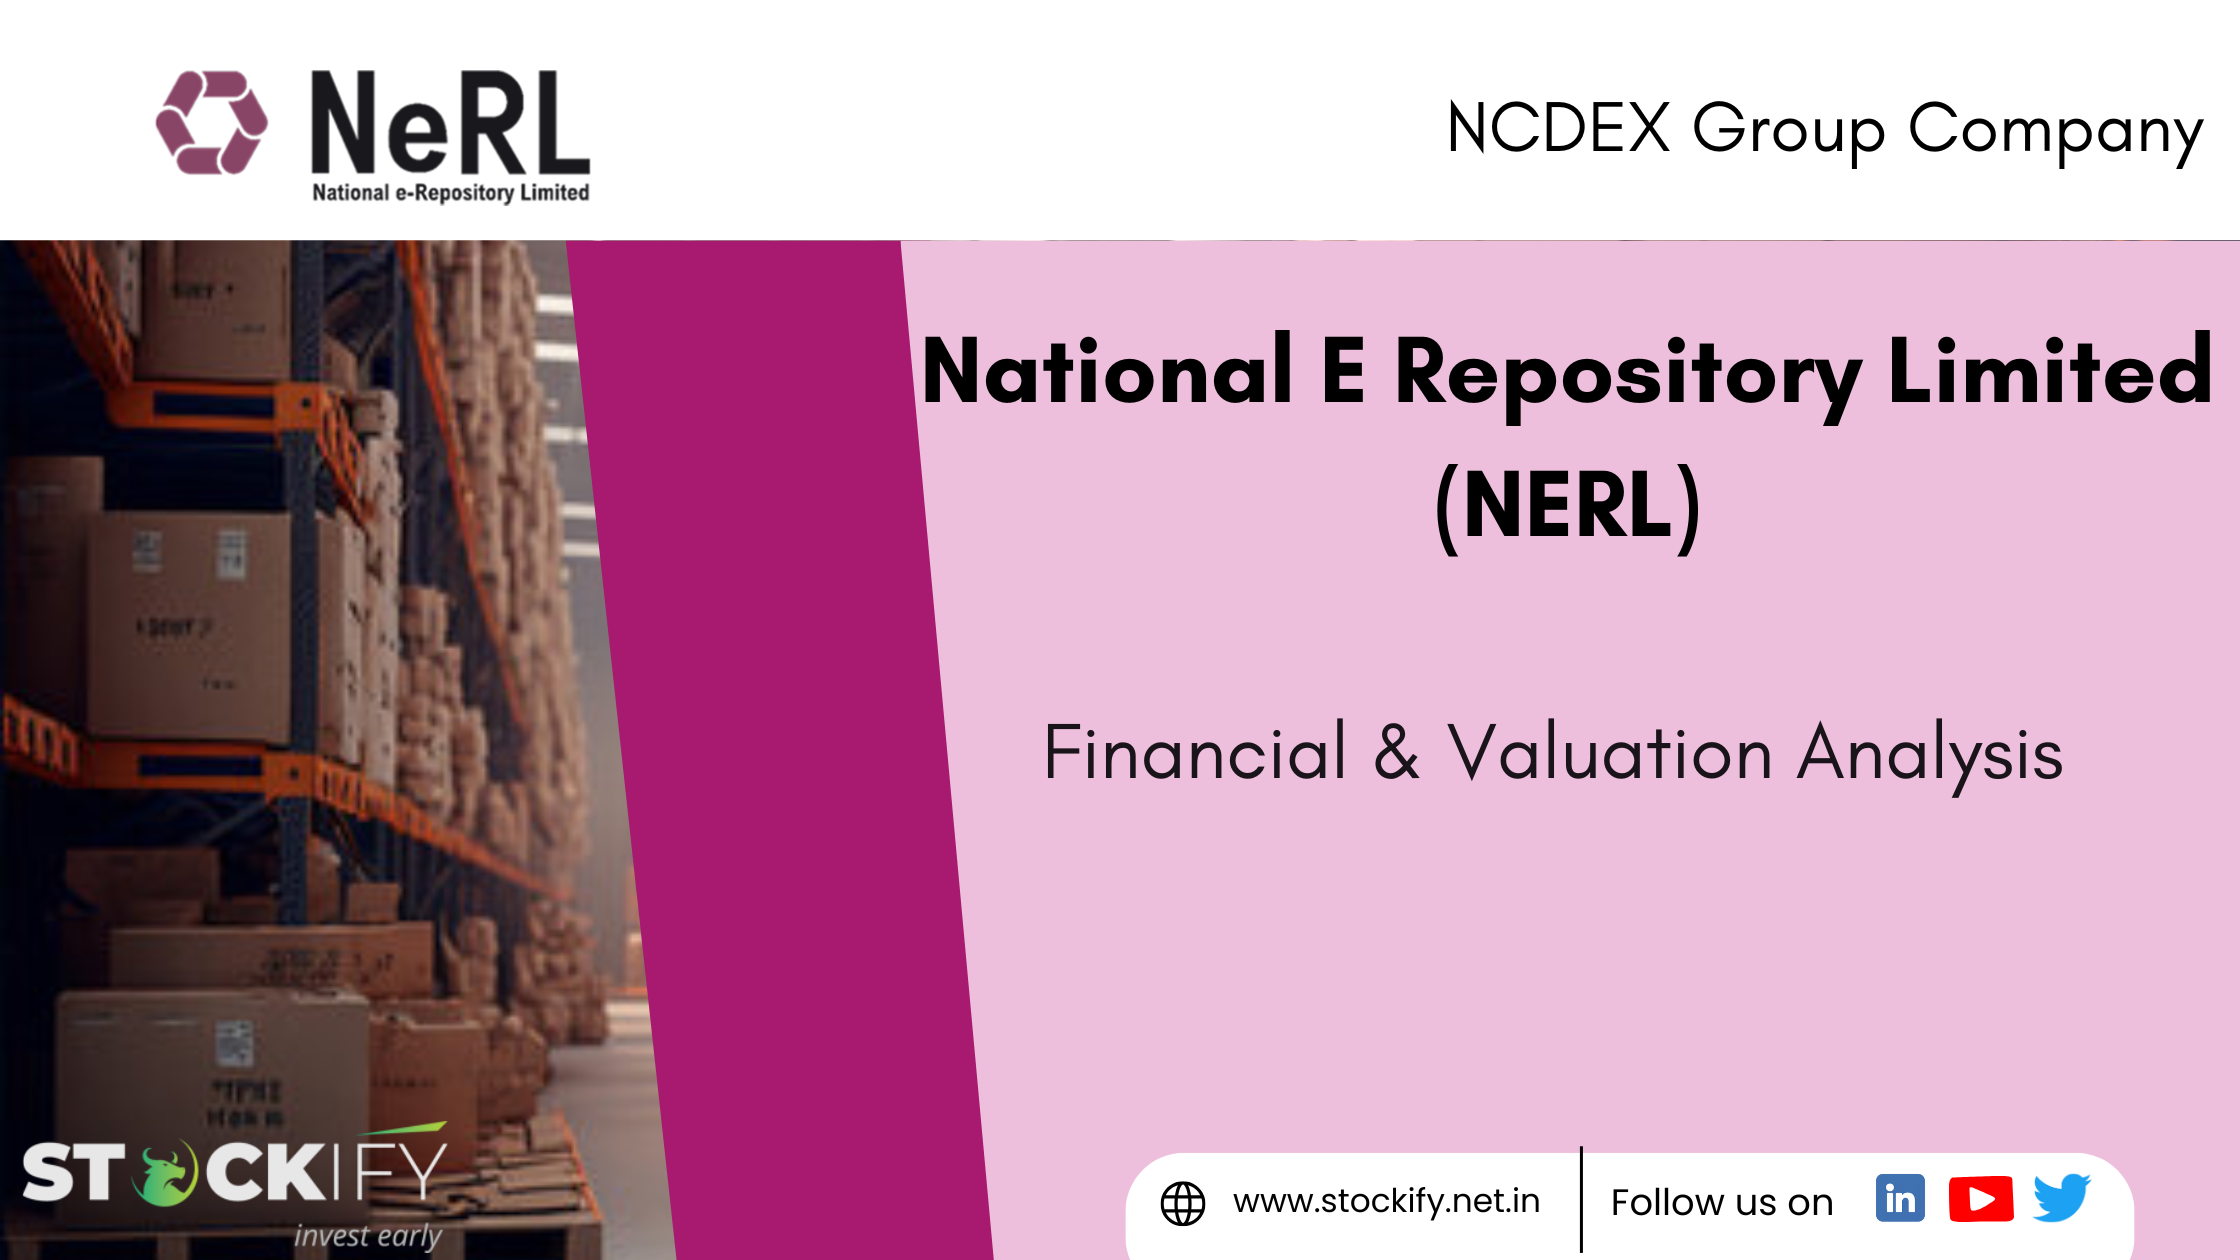
National E Repository Limited Unlisted Shares Financial Analysis
Particulars (Amount in Rs Crores) | FY 24-2025 | FY 23-2024 | FY 22-2023 |
Gross Revenue / Net Revenue | 12 | 10.8 | 9.6 |
EBITDA | (3.2) | (2.7) | (2.2) |
Net Loss | (4.1) | (5) | (5.5) |
EPS | (0.49) | (0.6) | (0.7) |
A) Revenue Growth
Consistent double-digit revenue growth reflects strong business momentum. With a decent revenue growth of 12.5% in FY 24 and 11% in FY 25.
This can certainly support long-term upside in National e repository limited unlisted shares price, if sustained.
B) EBITDA
EBITDA losses are increasing. YoY Losses grew from 2.2 Cr to 3.2 Cr over 3 years. Even though revenue is rising, the company is spending more than its earnings from operations. This suggests a negative short-term signal for fundamental investors and impact nerl share price.
C)Net Loss
Net loss is shrinking from Rs 5.5 Cr to Rs 4.1 Cr over 3 years. The company is still losing money, but at a slower pace.
Thus reflecting a drop in the growth of National e repository limited unlisted shares price.
D)Earnings Per Share
EPS is consistently improving from a - Rs 0.70 per share to a negative Rs 0.49 per share. The company is losing less per share each year.
Earnings per share and P/E Ratio affect the national e repository limited unlisted shares price.
Nerl Unlisted Share Price Analysis
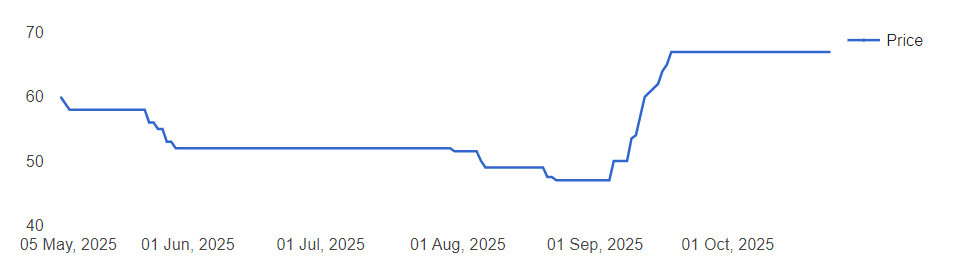
Flat trading suggests uncertainty or wait-and-see behavior. From June to September 2025. The nerl share price starts near ₹60 and declines gradually, suggesting prolonged weakness or a lack of catalyst. The stock stabilizes in the low ₹50s before dipping slightly below ₹50.
A sharp upward rally begins in Early September 2025, Nerl's unlisted share price increases from ₹50 to ₹68, which is approximately a 36% gain in 2 weeks. The market may have interpreted this as a strong signal of a turnaround. Sometimes, such price jumps precede or follow institutional interest or upcoming announcements.
The price peaks close to Rs 68 -Rs 69. After the sharp rise, the national e repository share price stabilized. It shows Profit booking by early buyers, and the Market waits for the next milestones.
The company appears to be in a turnaround or growth investment phase, which will likely be a major trigger for upward nerl unlisted share price movement. If current trends hold and operating efficiency improves, sentiment may gradually turn positive.
Currently the nerl share price is trading at Rs 64 per share.
How To Apply For National E Repository Limited Unlisted Shares Online?
Buying and selling unlisted shares can be complex if you’re not aware of the process correctly. If you’re considering buying National E Repository Limited Unlisted Shares and need help with how to go about it, India’s best unlisted shares broking platforms are here to help.
There are many factors to consider before applying to unlisted shares, including EPS growth, KPI, EBITDA Margin, Profit & Loss summary, etc. The experts at Stockify will provide you with every valuable piece of information you need.
Check National E Repository Limited Unlisted Shares Price At Stockify
At Stockify, you get updated prices of National E Repository Limited Shares, and the National E Repository Limited Unlisted Shares Price is Rs.64 per share. Keeping oneself updated with the costs of unlisted shares makes buying and selling easy. Since our experts possess a tremendous knowledge of the grey market, they update the prices whenever they get changed.
So log in and subscribe to our Finance Newsletter for regular stock updates.
Check Out Prices Of Other Unlisted Shares On Stockify
Are you interested in buying unlisted shares of other companies apart from NERL? If yes, Stockify brings you a vast list of leading companies offering unlisted shares for potential investors to earn something big. You can choose the company to invest in the stock from manufacturing to healthcare, education, and energy. The companies you will find on Stockify are the best unlisted shares in India to buy. Just scroll through our list and get the updates on any unlisted company you’re looking for. For more information, we’re always here; connect with us.
Reliance Retail, Pharmeasy, Chennai super kings, Anglo-French Drugs & Industries, Hexaware Technologies Ltd, Five Star Business Finance Ltd Unlisted Shares, Fincare Small Finance Bank Ltd Unlisted Shares, Arohan Financial Services Unlisted Shares, Utkarsh Coreinvest Ltd Unlisted Shares, Fino Paytech Ltd Unlisted Shares, Hero Fincorp Ltd Unlisted Shares, National Stock Exchange Ltd Nse Unlisted Shares, National Commodity Derivatives Exchange Ltd Ncdex Unlisted Shares, MetroPolitan Stock Exchange MSEI Unlisted Shares, Capital, Small Finance Bank Ltd Unlisted Shares, And Motilal Oswal Home Finance Ltd Unlisted Shares.
