Pharmeasy (API) Unlisted Shares
About The Company
Strong
Market Position
Consistent
YoY Growth
Experienced
Management
Key Indicators
A snapshot of Pharmeasy (API) Unlisted Shares's financial health, valuation multiples and capital efficiency at a glance.
Pricing Trends
Financial Performance
| Indicators | 2025 | 2024 | 2023 | 2022 | 2021 | 2020 |
|---|---|---|---|---|---|---|
| Revenue | 5,980.0 | 5,758.9 | 6,699.7 | 5,781.0 | 2,360.7 | 737.4 |
| Expense | 6,533.5 | 6,311.0 | 8,065.1 | 8,074.5 | 2,904.6 | 1,053.7 |
| EBITDA | -553.4 | -552.1 | -1,365.4 | -2,345.7 | -543.9 | -316.3 |
| Other Cost | 963.4 | 1,969.8 | 3,831.2 | -843.8 | 76.3 | 30.7 |
| PBT | -1,516.9 | -2,521.9 | -5,196.6 | -3,971.4 | -620.3 | -347.0 |
| Tax Expense | 55.5 | 11.5 | 15.2 | 21.7 | 21.1 | -11.7 |
| PAT | -1,572.4 | -2,533.4 | -5,211.8 | -3,993.2 | -641.3 | -335.3 |
| Other Inc./Exp. | 0.0 | 2.3 | 9.2 | -34.5 | 5.1 | 0.1 |
| Net Income | -1,572.4 | -2,531.1 | -5,202.6 | -4,027.7 | -636.3 | -335.2 |
| Shares O/S | 1,703.30 | 624.00 | 614.20 | 553.10 | 238.70 | 238.70 |
| EPS (₹) | -1.05 | -4.10 | -8.50 | -7.30 | -2.70 | -1.50 |
| Rev. Growth % | 3.8% | -14.0% | 15.9% | 144.9% | 220.1% | — |
| EBITDA Mgn % | -9.3% | -9.6% | -20.4% | -40.6% | -23.0% | -42.9% |
| Net Mgn % | -26.3% | -44.0% | -77.7% | -69.7% | -27.0% | -45.5% |
| EPS Growth | -74.4% | -51.8% | 16.4% | 170.4% | 80.0% | — |
Registered Address
Management Team
Download Financial Results
In The News


From The Experts


Top Unlisted companies


Frequently Asked Questions
Still have questions?
Our expert team typically responds within 30 minutes during market hours.
About PharmEasy Unlisted Shares (API Holdings Ltd.)
What kind of company is PharmEasy?
India’s digital consumer healthcare app, PharmEasy is referred to as a super app, offering customers on-demand access to home delivery for a comprehensive range of prescriptions and OTC pharmaceuticals. The company provides consumer healthcare products, information, consultations, and diagnostics tests from renowned laboratories. The company has collaborated with trusted doctors and registered in-store pharmacies. Incorporated in 2015, PharmEasy currently has over 2 million registered users and 17 million monthly active users. Moreover, with a market capitalization of approximately ₹5307 crores, PharmEasy unlisted shares are presently a whizz among investors and financial advisors.
Established by Dharmil Seth and Dr Dhaval Shah, PharmEasy serves every habitable zip code. The authorized share capital of the company is Rs. 1031.08 Cr and the total paid-up capital is Rs. 619.69 Cr. The initial idea of the company was to give end users an online pharmacy, but with the inclusion of consultation from trusted doctors and diagnostic tests from renowned laboratories, the application turned out to be quintessential. Furthermore, the company closed a revenue of Rs 56,642 Million in the fiscal year 2024 as opposed to Rs.66,997 Million in FY2023.
PharmEasy Unlisted Share Price Overview
Ebbs and flow is a part of every company, and in the previous years, almost every firm hit its all-time low, and so was PharmEasy. However, India’s largest digital healthcare platform boasts the potential to overcome its low. Since 2022, PharmEasy share price has been sliding down. By Dec 23, the share price of the company reached Rs 30 per share.
Despite a reduction in losses, PharmEasy share price has another take in the market. pharmeasy unlisted share price witnessed a decline of Rs. 22 in April 2023 and fell to Rs. 12 per equity share in October 2023.
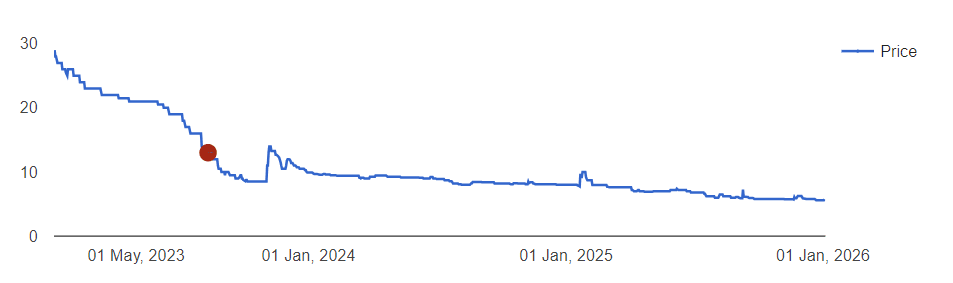
After trading near Rs 35–40 in early FY23, the price declined rapidly to Rs.10 by mid FY23 and has since stabilised in the Rs 5.5–Rs 8 range through FY25. This shows the market repricing the business closer to its underlying fundamentals after years of aggressive growth expectations.
The price action reflects the company’s financial transition. Revenue fell from Rs 6,699.7 Cr in FY23 to Rs 5,758.9 Cr in FY24, before a mild recovery to Rs 5,980 Cr in FY25, indicating that scale growth has slowed materially. Profitability has improved in direction, but not yet in sustainability.
Presently, valuation is driven more by future optionality than present earnings.
Financial Analysis of Pharmeasy Unlisted Shares
Particular (in Rs Cr) | 2025 | 2024 | 2023 |
Revenue | 5,980 | 5,758.90 | 6,699.70 |
EBITDA | -553.4 | -552.1 | -1,365.40 |
PAT (Net loss) | -1,572.40 | -2,533.40 | -5,211.80 |
Net Margin | -26.30% | -44% | -77.70% |
Cash | 119 | 327.9 | 193.6 |
Total Assets | 6,976.60 | 8,389.60 | 8,256.40 |
Total Equity | 3,272.30 | 2,588.40 | 2,436.90 |
Debt Level | 3,704.30 | 5,801.20 | 5,819.50 |
EPS | -1.05 | -4.1 | -8.5 |
Revenue declined sharply from Rs 6,699.7 crore in FY23 to Rs 5,758.9 crore in FY24, reflecting a contraction of nearly 14%. This decline raised concerns around market share retention, competitive pricing pressure and consumer demand volatility in the online pharmacy sector.
In FY25, revenue recovered slightly to Rs 5,980 crore, but it remains well below peak levels, showing that the business has not fully regained momentum.
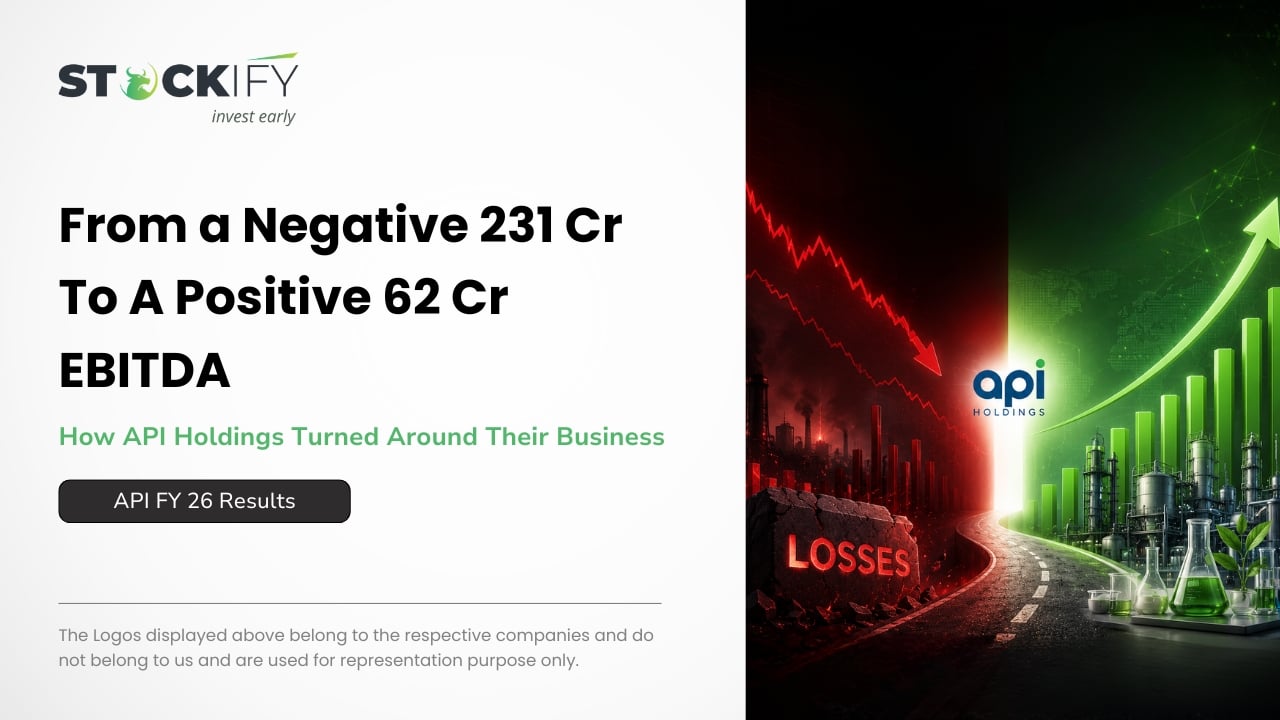
Despite weak revenue growth, losses have reduced significantly. Net loss improved from Rs 5,211.8 crore in FY23 to Rs 2,533.4 crore in FY24 and Rs 1,572.4 crore in FY25, reflecting aggressive cost controls and restructuring efforts.
EBITDA losses have also narrowed, from Rs 1,365.4 crore in FY23 to Rs 552.1 crore in FY24 and Rs 553.4 crore in FY25. But margins remain negative, meaning the company has not yet found a sustainable profit model. The persistent negative EBITDA shows ongoing pressure on unit economics, high customer acquisition and servicing costs and limited scale-based operating leverage.
Until EBITDA moves into stable positive territory, valuation expansion remains difficult.
However, despite this progress, the losses remain too large to support sustainable shareholder value creation. Multiple years of negative EPS, from -8.5 in FY23 to -1.05 in FY25, indicate erosion of investor returns, contributing to ongoing pressure on API Holdings’ share price in the unlisted market.
Overall, the gradual improvement in losses is encouraging, but profitability, liquidity and scale remain critical challenges. Until the company demonstrates consistent positive cash flow, the unlisted share price is likely to stay under pressure.
Why Buy PharmEasy Unlisted Shares?
PharmEasy emerged as the most prominent name in the industry after its merger in 2020. With API Holdings as the parent company, PharmEasy is determined to show a staging growth rate, and investors are anticipating nothing less from the firm. Its parent company witnessed a total income that was more than doubled to $714 million in the fiscal year 2022. Though the PharmEasy stock price witnessed a low in the last few months, the data below clearly depicts that investors are not ready to sell their PharmEasy unlisted shares, further indicating their belief in the growth.
Pharmeasy Share 2026 Plans
From August 25, Rahul Guha has taken charge as the MD & CEO of Pharmeasy. Setting ambitious plans for FY 26-27, including full-year EBITDA profitability and PAT positivity by March 2027.
“Our overall vision is to build India’s best digital health platform,” Guha told Moneycontrol in an interview. “But my first priority is to get the group back on a profitability path.”
How To Apply For PharmEasy Unlisted Shares Online?
Buying PharmEasy unlisted shares is pretty easy, especially with Stockify. We are here with an ensemble of details such as Key Performance Indicators, revenue growth, EBITDA margin reports, EPS growth, etc. Moreover, the expert stockbrokers at Stockify constantly keep track of the trends and changes in the PharmEasy unlisted shares price and update prices as per the market fluctuation daily.
PharmEasy stock price is currently the talk of the town. Analyse and compare the key indicators, figure out your requirements and rely on our experts to guide you throughout the PharmEasy unlisted shares buying process. We will take care of everything – from guidance to documentation.
Check PharmEasy Unlisted Share Price at Stockify
The PharmEasy company share price is updated every day at Stockify. Our experts stay updated with stock market trends and keep a close eye on PharmEasy stock price fluctuations and immediately update prices as per the market trends on a daily basis. If you are interested in buying PharEasy Unlisted Shares, connect with us and stay tuned to our prices.
You can subscribe to our newsletter to get regular updates regarding PharmEasy share price, market trends, and other indicators that assist in determining whether or not a share is beneficial for your portfolio.
Check Out Prices Of Other Unlisted Shares On Stockify
For those who want to cope with market fluctuation, portfolio diversification is paramount for them. Diversification is a vital way to minimise the blow that hits while the market goes down. Stockify brings a list of unlisted shares from top-rated Pre-IPO companies at authentic prices. Apart from buying and selling PharmEasy unlisted shares, you can also check the best unlisted shares in India. We bring you unlisted shares from all the sectors – IT, energy, healthcare, insurance, technology, finance, manufacturing, and many more. Take a look at the PharmEasy share price and also glance up other unlisted shares hosted by Stockify.
