Frick India Pvt Ltd Unlisted Shares
About The Company
Strong
Market Position
Consistent
YoY Growth
Experienced
Management
Key Indicators
A snapshot of Frick India Pvt Ltd Unlisted Shares's financial health, valuation multiples and capital efficiency at a glance.
Pricing Trends
Financial Performance
| Indicators | 2025 | 2024 | 2023 | 2022 | 2021 | 2020 | 2019 | 2018 |
|---|---|---|---|---|---|---|---|---|
| Revenue | 447.6 | 493.7 | 369.3 | 287.7 | 237.5 | 227.0 | 248.1 | 262.9 |
| Expense | 395.5 | 435.3 | 326.6 | 261.9 | 206.0 | 205.9 | 224.2 | 236.7 |
| EBITDA | 52.1 | 58.4 | 42.7 | 25.9 | 31.6 | 21.1 | 23.9 | 26.2 |
| Other Cost | 6.1 | 5.5 | 4.1 | 4.0 | 4.2 | 2.6 | 2.4 | 8.2 |
| PBT | 46.0 | 52.9 | 38.6 | 21.9 | 27.3 | 18.5 | 21.5 | 18.0 |
| Tax Expense | 11.3 | 10.6 | 10.0 | 5.5 | 6.5 | 3.9 | 6.3 | 4.4 |
| PAT | 34.7 | 42.3 | 28.5 | 16.4 | 20.8 | 14.6 | 15.2 | 13.7 |
| Other Inc./Exp. | -0.1 | -0.1 | -0.2 | -0.1 | -0.2 | 0.4 | -0.2 | -0.4 |
| Net Income | 34.5 | 42.2 | 28.3 | 16.3 | 20.7 | 15.0 | 15.0 | 13.3 |
| Shares O/S | 0.60 | 0.10 | 0.10 | 0.10 | 0.10 | 0.10 | 0.10 | 0.10 |
| EPS (₹) | 57.76 | 70.50 | 475.50 | 272.70 | 347.00 | 243.50 | 253.00 | 228.20 |
| Rev. Growth % | -9.3% | 33.7% | 28.4% | 21.1% | 4.6% | -8.5% | -5.6% | — |
| EBITDA Mgn % | 11.6% | 11.8% | 11.6% | 9.0% | 13.3% | 9.3% | 9.6% | 10.0% |
| Net Mgn % | 7.7% | 8.5% | 7.7% | 5.7% | 8.7% | 6.6% | 6.0% | 5.1% |
| EPS Growth | -18.1% | -85.2% | 74.4% | -21.4% | 42.5% | -3.8% | 10.9% | — |
Registered Address
Management Team
Download Financial Results
In The News


From The Experts

Top Unlisted companies


Frequently Asked Questions
Still have questions?
Our expert team typically responds within 30 minutes during market hours.
About Frick India Private Limited
Frick India Limited is a public limited company incorporated in 1962. It is the world's largest industrial air-conditioning and refrigeration manufacturer that adapts new technologies to meet its customers' industrial refrigeration application needs. With over 50 years of experience, Frick India exports its products to more than 45 countries. Its authorized share capital is INR 20.00 cr and the total paid-up capital is INR 6.00 cr.
What does Frick India do?
Frick India Limited is a leading provider of industrial refrigeration solutions in India. The company specializes in manufacturing and supplying a wide range of equipment and turnkey solutions for various industries.
Who is the CEO of Frick India?
The CEO of Frick India is Jasmohan Singh, who has been serving as the Managing Director since 1999.
The company has an unmatched advantage of producing turnkey and air-conditioning systems covering designing, manufacturing, packaging, and installation. If you plan to buy Frick India unlisted shares, this page will provide essential details about the company, like Frick India share price, opportunities and strengths, etc.
Industries Served By Frick India Limited
Frick India Limited is listed among the top 10 companies in India due to its good quality and highly-rated equipment. It serves various industries through its products and manufacturing facilities, which include:
Dairy and Ice Cream
Food and Agriculture
Beverages & Brewery industry
Meat, poultry and Seafood
Chemical & Pharmaceuticals
Air Conditioning
Low-temperature application
The products which majorly contributed to Frick India Ltd's overall revenue are liquid overspeed systems, evaporative condensers, Two Stage compound reciprocating compressors, and rotary twin screw compressor blocks.
Financial Performance Of Frick India Limited
Particulars (In Rs. Cr.) | FY25 | FY24 | FY23 |
Revenue | 447.6 | 493.7 | 369.3 |
EBITDA | 52.1 | 58.4 | 42.7 |
EBITDA Margin | 11.60% | 11.80% | 11.60% |
PAT | 34.7 | 42.3 | 28.5 |
Net Margin | 7.70% | 8.50% | 7.70% |
EPS | 57.76 | 70.5 | 475.5 |
1️. Revenue
Frick India’s revenue came in at Rs 447.6 crore in FY25, down from Rs 493.7 crore in FY24, a 9.3% dip YoY.
FY24 saw abnormally strong order flows as cold storage, food processing and pharma clients rushed to expand post-COVID.
FY25 looks more like a normalisation rather than a collapse. Industrial refrigeration equipment is a project-based business, so in simple terms, companies don’t buy heavy refrigeration systems every year. Some projects get delayed, not cancelled. So the slowdown reflects timing, not trouble.
2. EBITDA
Even with lower revenue, EBITDA stayed at Rs 52.1 crore in FY25, down from Rs 58.4 cr in FY24.
For a manufacturing business, this consistency signals cost structure under control, no panic discounting to chase sales and pricing power still intact.
Hence, this is a quiet signal of strength. When the market slows, but margins don’t collapse, it suggests a stable product portfolio with loyal B2B clients.
3️ Operating Profit Margin
The company’s operating margin has stayed between 11.6% and 11.8% for 3 straight years. This suggests the business has reached a steady yield zone, where margins won’t jump dramatically unless there’s a major scale expansion.
So instead of looking for sudden spikes, you can expect compound progression, small, steady improvements that show up over time.
4️. Profit After Tax (PAT)
PAT dropped from Rs 42.3 crore to Rs 34.7 crore, but this is proportional to the revenue drop, not because margins collapsed or costs spiralled. Tax expense was also normalised, which contributed to the lower bottom line.
Hence, a company in trouble sees PAT crash faster than revenue, which is not the case here.
5. EPS
EPS dropped to Rs 57.76 in FY25 from Rs 70.5 in FY24. EPS volatility is expected here because outstanding shares have changed, and FY24 was unusually high due to a stronger revenue cycle.
Therefore, even with this dip, EPS is still healthy for its price range, and at around 33x P/E, the stock feels fairly valued rather than overpriced in the unlisted market.
Improved financial metrics over the years also positively affect Fricks India Ltd share price.
How has frick india share price performed?
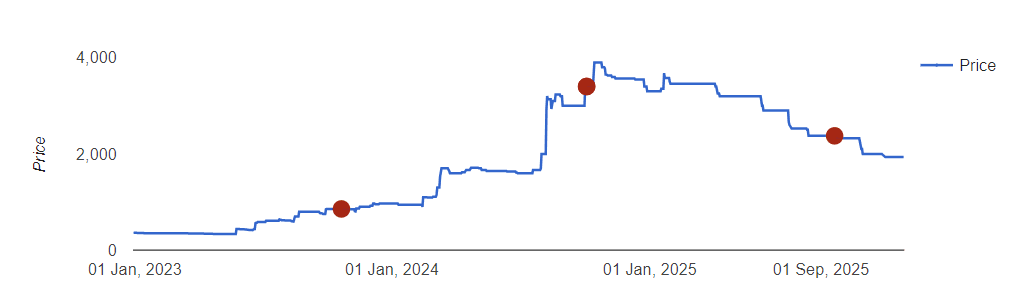
Frick Indias unlisted share journey has pretty much completed a full emotional cycle from quiet accumulation to sharp re-rating and now settling into a more realistic zone (correction).
The stock moved from around Rs 350 in early 2023 to Rs 3,400 to Rs 3,500 by late 2024, driven by strong demand for industrial refrigeration during the post-COVID expansion cycle and increased visibility around the company’s order book.
The 9:1 bonus issue in FY24 also improved liquidity and drew in new investors, which added fuel to the rally.
But FY25 acted like a reality check (a correction happened), revenue dipped 9.3% YoY to Rs 447.6 Cr and PAT to Rs. 34.7 Cr, so the price normalised to the Rs 1,900 to Rs 2,000 range as investors adjusted expectations rather than panic selling.
Till Jan 23 Frick India ltd unlisted share was traded at Rs 3350 per equity share, which increased positively over the last few months.
Comparison Of Frick India With Its Top Competitors
Frick India Ltd established itself as an industry leader in commercial refrigeration solutions. However, it directly competes with companies like Kirloskar Industries Ltd and Craftsman Automation Private Ltd. We will compare Fricks India Ltd with its peer competitors in financial metrics.
Company | Market Cap | Average Operating Margin | Book Value Per Share | P/B Ratio | D/E Ratio | P/E Ratio |
Frick India Ltd | INR 1,147.80 Crore | 11.7% | 514.20 | 3.70 | 0.30 | 33.20 |
Kirloskar Industries Ltd | INR 5,000 crore | 7% | 5,003 | 0.96 | 0.32 | 24.7 |
Craftsman Automation Ltd | INR 11,130 crore | 8% | 1,167 | 4 | 0.9 | 44.5 |
Despite having high competition, Frick India performs well in terms of financials. The frick india ltd unlisted shares have a better P/E ratio and profitability margin than its competitors.
Opportunities & Threats Associated With Fricks India Ltd
Fricks India Ltd share price depends on the company's current performance and market conditions. Before you invest in Fricks India, you need to assess the opportunities and threats associated with the company.
Opportunities
India is currently the largest producer of milk and the second largest producer of fruits and vegetables, which requires a specific temperature range for storage and transportation. This results in high demand for cold-chain infrastructure.
The surge in the pharmaceuticals and online grocery businesses opened up new opportunities for Frick India Limited.
Threats
The company faces a volatile risk in terms of input costs and raw materials, which can affect Frick India Ltd's operating margin.
Check Frick India Ltd Share Price On Stockify
Do you want to check the updated Frick India share price in India? Trust Stockify, where you will get accurate idea about frick india share price today as per fresh market data. Our team of unlisted share brokers and financial experts closely monitors price movement and updates the unlisted share prices based on recent market conditions. With us, you can buy Frick India Ltd unlisted shares hassle-free after analyzing the company's financial performance.
Check Out Price of Other Unlisted Shares
Apart from frick india limited share price, you can also check the price of other trending unlisted shares in India on Stockify. Explore other top-performing
