PNB Finance and Industries Ltd Unlisted Shares
About The Company
Strong
Market Position
Consistent
YoY Growth
Experienced
Management
Key Indicators
A snapshot of PNB Finance and Industries Ltd Unlisted Shares's financial health, valuation multiples and capital efficiency at a glance.
Pricing Trends
Financial Performance
| Indicators | 2025 | 2024 | 2023 | 2022 | 2021 | 2020 | 2019 | 2018 |
|---|---|---|---|---|---|---|---|---|
| Revenue | 10.5 | 11.6 | 11.3 | 15.6 | 7.1 | 16.5 | 18.4 | 15.4 |
| Expense | 1.7 | 3.0 | 3.4 | 2.0 | 1.4 | 1.2 | 0.6 | 0.7 |
| EBITDA | 8.9 | 8.6 | 7.9 | 13.6 | 5.8 | 15.3 | 17.8 | 14.7 |
| Other Cost | 0.0 | 0.0 | 4.9 | 0.0 | 0.0 | 0.0 | 0.0 | 0.0 |
| PBT | 8.9 | 8.6 | 3.0 | 13.6 | 5.8 | 15.3 | 19.3 | 14.7 |
| Tax Expense | 1.7 | 1.4 | 1.2 | 2.4 | 1.0 | 2.2 | 3.3 | 2.1 |
| PAT | 7.2 | 7.2 | 1.8 | 11.2 | 4.8 | 13.1 | 16.0 | 12.6 |
| Other Inc./Exp. | 658.5 | 0.0 | 0.0 | 0.0 | 0.0 | 0.0 | 0.0 | 0.0 |
| Net Income | 665.6 | 7.2 | 1.8 | 11.2 | 4.8 | 13.1 | 16.0 | 12.6 |
| Shares O/S | 0.32 | 0.30 | 0.30 | 0.30 | 0.30 | 0.30 | 0.30 | 0.30 |
| EPS (₹) | 22.37 | 22.60 | 5.60 | 34.90 | 15.00 | 41.10 | 50.00 | 39.30 |
| Rev. Growth % | -9.5% | 2.7% | -27.6% | 119.7% | -57.0% | -10.3% | 19.5% | — |
| EBITDA Mgn % | 84.8% | 74.1% | 69.9% | 87.2% | 81.7% | 92.7% | 96.7% | 95.5% |
| Net Mgn % | 6339.0% | 62.1% | 15.9% | 71.8% | 67.6% | 79.4% | 87.0% | 81.8% |
| EPS Growth | -1.0% | 303.6% | -84.0% | 132.7% | -63.5% | -17.8% | 27.2% | — |
Registered Address
Management Team
Download Financial Results


Top Unlisted companies


Frequently Asked Questions
Still have questions?
Our expert team typically responds within 30 minutes during market hours.
About PNB Finance and Industries Unlisted Shares
PNB Finance and Industrial Limited is a non-banking financial company that was first incorporated under Punjab National Bank Limited in 1894. Then the banking business was acquired by the Central Government of India, and the company's name was changed to PNB Finance. The company later took its step toward the investment business and started trading shares, bonds, debentures and other securities. Soon after, in 1981, the company's name was changed to PNB Finance and Industries Limited. Under the RBI (Reserve Bank Of India), the company became a non-banking financial company in 1998.
Incorporation Details
CIN | L65929DL1947PLC001240 |
Registration Date | 19 May 1894 |
Category Sub Category Of Company | Company Limited By Shares Non-govt Company |
RoC Registration Number | RoC- Delhi 1940 |
Class Of Company | Public |
Company Age | 75+ Years |
PNB Finance and Industries Limited has been primarily in finance for over 75 years. Currently, the company is not engaged in any business operations. Besides, the surplus invests in low-risk instruments and trades at a massive PNB finance share price. The company neither holds nor accepts public deposits nor carries out investment activities as a business operation. Mutual Funds make up the larger part of the investment portfolio of the stock price PNB.
PNB Finance and Industries Unlisted Share Price Overview
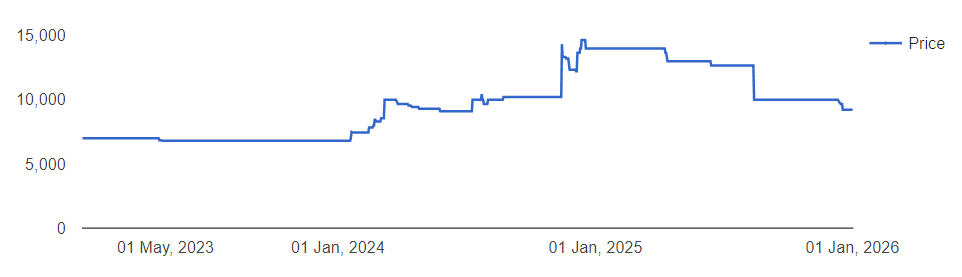
As you can see in the chart, PNB Finance unlisted share price climbed from Rs 9,100 in mid FY24 to Rs 13,000–Rs 13,500 in early 2025, driven by reserve growth and improved profitability. This shows an exceptional FY25 profit boost from investment gains.
In mid FY25, the stock corrected and stabilised around Rs 9,000 to Rs 12,000 as investors booked profits and reassessed sustainability
The book value per share of Rs 10,296 against a valuation lower than that indicates that the market still values PNB more as an asset holding company rather than a high growth lender.
With a P/B near 0.9, the company is trading below intrinsic value, reflecting a potential opportunity if earnings stabilise. However, the P/E remains elevated due to unusually high FY25 profits driven by one-time investment gains, not recurring operations, and this should be viewed cautiously.
The current PNB Finance share price is Rs 8505 per share.
PNB Finance And Industries Limited Financials
Particulars (in cr) | 2025 | 2024 | 2023 |
Revenue | 10.5 | 11.6 | 11.3 |
EBITDA | 8.9 | 8.6 | 7.9 |
EBITDA Margin (%) | 84.80% | 74.10% | 69.90% |
Net Profit | 665.6 | 7.2 | 1.8 |
Net Margin (%) | 6339% | 62.10% | 15.90% |
EPS | 22.37 | 22.6 | 5.6 |
PNB Finance & Industries isn’t your typical NBFC chasing loan books and market share. Think of it more like a silent compounder, sitting on assets, making strategic investment moves.
The revenue for FY25 stood at Rs 10.5 crores, a 9.5% decline from the previous year, indicating that PNB Finance & Industries isn’t pursuing aggressive growth. The strength here is its intelligent capital management.
Operating expenses dropped sharply, pushing EBITDA to Rs 8.9 Cr with an 84.8% margin, proving that the business is prioritising efficiency.
The headline moment came from Rs 658.5 Cr in other income, taking FY25 profit to Rs 665.6 Cr, which is a strategic win by asset decisions and revaluation gains rather than lending volume.
This shows smarter asset decisions, valuation gains or strategic investment exits, similar to a business leveraging its balance sheet strength instead of chasing risky lending growth.
What matters for an NBFC is stability, and PNB seems positioned well. The Capital Adequacy Ratio (CAR) is expected to be healthy given the 0.2 debt to equity, which means the leverage risk is extremely low and the liquidity position (despite near-zero cash) is backed by high-quality current assets, showing confidence in asset convertibility.
Liquidity is backed by Rs 3,811 Cr in current assets, and despite low cash, convertibility remains strong.
ROE of 20.2% and ROA of 17.4% show that the company is starting to look like an NBFC, where returns come from smart balance sheet management instead of risky lending.
Why Buy PNB Finance and Industries Unlisted Shares?
PNB finance share price has not seen any significant decline in previous years due to its prudent investment decisions. Considering the economic factor, the company is taking investment and redemption decisions even more cautiously to protect the investor’s share price, PNB, and the interests of the company's stakeholders. Seeing all the efforts, the investors can be assured that their capital is not at risk and can freely invest in the stock price of PNB.
PNB Finance & Industries is the oldest company and is backed by the largest public Indian bank, Punjab National Bank. It has already been registered under the Reserve Bank of India as a non-banking finance company that keeps the credibility stake high among investors. PNB Finance & Industries Limited unlisted shares have consistently shown good growth from Rs. 7,000 per share to Rs. 10,000 per share without any major fluctuation over the year. You can invest through Stockify!
How To Apply For PNB Finance And Industries Unlisted Shares Online?
Buying PNB Finance share price is very simple, especially on Stockify. We have curated a list of details, such as key performance, revenue growth, EBITDA margin, EPS growth, etc., of PNB Finance and Industries Limited here. The professionals at Stockify will help you keep you on the latest trends and changes in the stock price PNB; moreover, we also update our share price PNB daily based on stock market fluctuations. If you need clarification about how to apply for PNB Finance share price, rely on our experts to walk you through the buying process of PNB Finance and Industries Limited stocks.
You can rely on our experts at Stockify, from guidance to documentation.
Check PNB Finance and Industries Unlisted Share Price Today at Stockify
At Stockify, we closely monitor the daily trends and stock price of PNB. The current PNB finance share price can be easily found; check it above and analyse & compare the key indicators and make your decision. In case you are looking for alternatives, subscribe to our newsletter; we provide regular updates regarding the share price of PNB, market trends, and other performance indicators that will assist you in determining if buying PNB Finance share price is beneficial for you.
Check Out Prices Of Other Unlisted Shares On Stockify
Investing in unlisted shares is crucial for portfolio diversification, especially if you want to cope with stock market fluctuations. Stockify brings a line of unlisted shares of all the top-rated companies at an authentic price. Apart from buying unlisted shares, you can also sell pre-IPO shares through Stockify by following a simple process. Take a peek at the PNB Finance share price today and other unlisted shares listed below:
Chennai Super Kings, Reliance Retail, boAT Unlisted Shares, Anglo-French Drugs & Industries, Hexaware Technologies Ltd, National Commodity Derivatives Exchange Ltd Ncdex Unlisted Shares, Five Star Business Finance Ltd Unlisted Shares, National Stock Exchange Ltd Nse Unlisted Shares, Fincare Small Finance Bank Ltd Unlisted Shares, Arohan Financial Services Unlisted Shares, MetroPolitan StockExchange MSEI Unlisted Shares, Utkarsh Coreinvest Ltd Unlisted Shares, Fino Paytech Ltd Unlisted Shares, Hero Fincorp Ltd Unlisted Shares, Capital, Small Finance Bank Ltd Unlisted Shares, and Motilal Oswal Home Finance Ltd Unlisted Shares.
