
Table of Contents
Buy/Sell Your Unlisted Shares
Submit the details below to share a quote.
After years of limited activity and repeated questions about its future, the Metropolitan Stock Exchange of India (MSEI) has officially resumed trading from 27th Jan, 2026. Live trades are now visible on the exchange’s website, indices are updating in real time, and market turnover data is being published.
Adding to this early momentum, MSEI will held a special trading session on February 1, 2026, the day the Union Budget 2026 is presented. This year’s Budget carried a unique twist. It was presented on a Sunday for the first time, prompting regulators to keep markets open to avoid a buildup of risk and uncertainty.
A) What All Happened On 27th Jan, 2026?
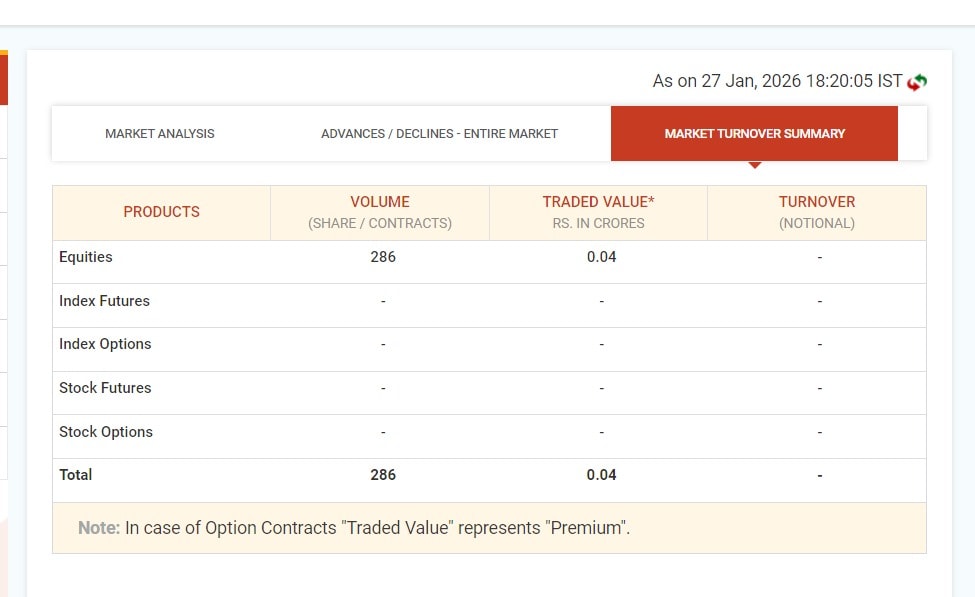
As per the latest MSEI market turnover data:
Equity trading has recorded 286 shares traded
Total traded value stands at around Rs 4 lacs.
Other segments, such as index futures, options and stock derivatives, have not yet seen activity
In addition to this, MSEI’s key indices like SX40 and SXBANK are now showing live data, including open, high, low, and last traded values. This confirms that:
Trading systems are live
Order matching is working
Price dissemination is active
Hence, from a market structure perspective, this is the first essential milestone for MSEI as it restarted trading now.
While the scale of activity remains modest, the restart marks an important shift. MSEI has moved from being an inactive exchange to a functioning market platform. It may not be a big move in terms of volumes or liquidity, but it is clearly a step in the right direction.
Slow Progress, But In the Right Direction
For any exchange, competing with NSE and BSE is not easy, especially one returning after a long pause. Hence, MSEI has chosen a cautious path.
Trading has begun with around 130 stocks
A SEBI-approved Liquidity Enhancement Scheme (LES)
The focus might be on stability rather than chasing volumes aggressively
This shows why current volumes are thin. The exchange seems to be prioritising orderly functioning first, liquidity later.
MSEI’s Special Trading Session On February 1
The Metropolitan Stock Exchange of India remained open for trading on February 1, 2026. Coming just days after the exchange resumed trading, this session can serve as an early real-world test of MSEI’s systems, liquidity support, and execution quality during a high-volatility event.
Trading alongside NSE and BSE, MSEI was closely monitored for how smoothly it handles price discovery under pressure.
B) MSEI Trading Volume Trends Since January 2026
The Metropolitan Stock Exchange of India (MSEI) restarted its equity trading segment in January 2026. Since then, trading volumes have gradually started building, though the market is still far smaller than the National Stock Exchange of India and BSE Limited.
However, when we analyse the weekly trading data from 27 January to 13 March 2026, some interesting trends emerge, including a sudden spike in trading volume in mid-February and periods of sharp liquidity shifts.
1. Weekly Trading Volume Analysis (27 Jan To 13 March 2026)
From the above table, we can analyse MSEI trading volumes from 27th Jan. Let's see how this turned out weekly
Trading Week | Total Quantity | Trade Value |
27 Jan - 2 Feb | 65k | Rs101 L |
3 Feb - 9 Feb | 213k | Rs 249L |
10 Feb - 16 Feb | 228k | Rs 482 L |
17 Feb - 23 Feb | 130k | Rs 944 L (Peak) |
24 Feb - 2 Mar | 54k | Rs 109 L |
3 Mar - 9 Mar | 231k | Rs 234L |
10 Mar - 13 Mar | 298k | Rs 289 L |
Sourced from MSEI Official Trade Summary
Week 1:
This was an initial liquidity testing week. This week's trading activity was restarted, so it is likely to have very low liquidity. The number of shares traded (65k) and the total value (Rs 101 lakh) were both low, indicating limited trading activity in MSEI during this period.
Week 2:
Trading activity picked up sharply this week. More shares were traded (213k), and the value (Rs 249 Lakh) also increased, showing growing interest from investors. This likely indicated an increase in broker participation, and more stocks might be activated.
Week 3:
This week saw very strong trading value. Although quantity (228k) increased only slightly from the previous week, the trade value (Rs 482L) almost doubled, meaning bigger trades or higher prices were happening.
Week 4:
This was the most important week, peak week. Even though the quantity traded was lower (130k) than in earlier weeks (228k), the trade value reached the highest level (Rs 944 L). This likely suggests that some large block deals or high-value transactions happened during that period, which pushed the overall traded value higher. We will discuss this in more detail later on.
Week 5:
Trading activity fell sharply this week after reaching its peak. Both quantity (54k) and trade value (Rs 109L) dropped, suggesting market activity cooled down.
Week 6:
Now here, after a sharp fall, the market recovered again. Trading quantity (231k) increased significantly, possibly showing renewed participation by trade (Rs 234L) and investors.
Week 7:
This week recorded the highest trading quantity (298k shares). It is likely showing very active trading, although the trade value was lower (Rs 289L) compared to February (week 4), which was at its peak.
2. Why Did Feb 17-20 Have Such High Trades?
Trade Date | Securities Traded | Value (In Rs. Lacs) |
16 Feb | 127 | 77.22 |
17 Feb | 128 | 179.38 |
18 Feb | 129 | 210.71 |
19 Feb | 126 | 240.49 |
20 Feb | 128 | 292.8 |
In week 4, MSEI’s trade value reached the highest (Rs 944 L). The possible reasons for such high trades can be the following:
A. Rise In Trading Securities:
Within a week, the number of securities traded increased sharply to around 120+ stocks. This means that previously, few stocks were traded, and this week, more stocks became active.
B. Market Makers Providing Liquidity (LES):
When a stock exchange wants to increase trading activity, it often relies on market makers. Market makers are participants who keep the market active by regularly placing both buy and sell orders. Their presence ensures that there is always someone ready to trade. Because they keep quoting prices throughout the day, it often leads to many small trades, which helps maintain steady activity and improves liquidity in the market.
3. Top Stocks Traded On MSEI recently
Daily trading on the Metropolitan Stock Exchange of India is usually concentrated in around 25-35 stocks, many of which receive support from the Liquidity Enhancement Scheme (LES) through market makers. Among the most actively traded stocks between March 11 and 13 were large and well-known companies like Wipro, which acted as a liquidity benchmark, along with HDFC Asset Management Company and TMPV.
The spikes in trading activity seen around March 5 and March 13 were likely driven by volume surges in recently permitted or active stocks such as Clean Max Enviro Energy Solutions Ltd, DCM Shriram International Ltd, and Prime Fresh Ltd. These stocks appear to have attracted higher participation during those days, contributing to the noticeable jump in trading activity.
C) MSEI Unlisted Share Jumps Almost 2X In 1 Month
In late December, shares were trading around Rs. 3.5 to Rs. 3.8, when optimism around a possible restart began building. In early January, the share price nearly doubled within two weeks, driven by expectations of a trading restart, SEBI’s approval of the Liquidity Enhancement Scheme (LES) and a Rs. 1,240 crore capital infusion.
As a result, the price rose from around Rs.3.85 to nearly Rs.7.50 by 19 January, largely on expectations. After trading resumed, a natural correction followed, with shares now trading around Rs.6. This appears to be a healthy adjustment, indicating that optimism remains, but investors are now looking for sustained liquidity and execution, not just announcements.
Read More Here About: MSEI Share Price Doubles In 1 Week. What's Happening?
D) Future Growth Prospects For MSEI Trading Activity
The Metropolitan Stock Exchange of India shows moderate growth potential in trading activity through 2026, although it still faces strong competition from the much larger National Stock Exchange of India and BSE Limited.
Previously, we have seen that the growth of MSEI was not so impressive, but it mainly got hype, likely due to the investment of Grow and the Kamath Brothers. Now, various other factors, such as the number of daily trades, as discussed previously in this blog, play an important role in MSEI's future growth.
After relaunching its equity segment, MSEI has been seeing average daily volumes of around 10,000-75,000 shares. The exchange has also raised about Rs.1,240 crore in capital, which is expected to support technology upgrades, liquidity programs, and expansion
There is also speculation about a possible MSEI IPO between February and May, which could improve the exchange’s visibility and attract institutional investors.
Also Read: Future Growth Rate of Metropolitan Stock Exchange (MSEI)
You may also like to read
What Are The Different Classes Of Shares Issued In India?

Different Classes of Assets In The Financial Market

Follow These Simple Share Market Tips While Investing

Importance of Investing in Unlisted Shares

Step-by-step Process Of Transferring Unlisted Shares (Off-market)

Pre IPO Success Stories To Start Your Unlisted Share Trading

What Is The Expected Return Of Unlisted Shares?

A Detailed Guide On How To Buy Unlisted Shares In India
Know Your Tax Implications Before Investing In Unlisted Shares

Common Mistakes To Avoid While Investing In Unlisted Shares
How To Pick Best Performing Unlisted Stocks in India?

Risks And Rewards Associated With Unlisted Share Investment

Difference Between Start-Up Investing And Unlisted Shares?

IPO Process in India: Key Steps Explained Clearly

Revealed: The Real Picture of Unlisted Shares in Grey Market

Key Financial Ratios And How To Use Them To Analyse Your Investment

101 Guide For Beginners: What Is Pre IPO Share Market?

10 Golden Rules Of Investing In Stock Market

Listed Shares Vs. Unlisted Shares - Detailed Comparison

The Dark Side of Paytm's IPO Explained In Details

What Leads to Delisting of Shares and What Goes Behind The Scenes?

When Should You Review Your Portfolio Professionally?

In-Depth Analysis of Pre-IPO Shares for Portfolio Growth

PharmEasy Unlisted Price Falls 70%. Here's why

Delaying Pre-IPO Investments? Here’s What You Risk

An NRI’s Guide To Invest In Unlisted Shares In India
Guide To Filter The Most Profitable Unlisted Companies In India

A Comprehensive Guide On Follow-on Stocks

Care Health Insurance

Smart Strategy to Buy & Sell Unlisted Shares Professionally

Top Highly Profitable Unlisted Companies In India To Look For As An Investor

Upcoming IPOs In 2022-2023

Expert’s Driven Roadmap To Research A Startup IPO

Capgemini Unlisted Shares: Is The Risk Worth?

HDFC Sec vs HDB Financial: Which Is the Better Pick?

Detailed Guide To Calculate Capital Gains on Unlisted Shares

Dematerialisation of Unlisted Shares and Its Impact On Shareholders

How are B9 Beverages Pvt Ltd (Bira91) Unlisted Shares Gaining Pace Again?

Reliance Retail: The Success Story of India's Largest Retail Brand

The Future Of Unlisted Shares In the Fintech Market
Employee Stock Ownership Plan: What, How, and Why?

Studds Unlisted Shares: 6 Reasons to Buy Now

LAVA’s Unlisted Shares Soar Under Atmanirbhar Push
NSE vs BSE: Detailed 101 Market Share Comparison

The Role Of Corporate Governance And Management In Unlisted Companies
What's Temperature Ahead Of Tata Technologies' ₹4,000 Cr. IPO?

The Future Outlook For Unlisted Shares As An Investment Option

How to Buy and Sell Unlisted Shares in India?

The Benefits And Drawbacks Of Investing In Unlisted Shares