1.jpg)
The National Stock Exchange (NSE) recently released its FY 25 Q1 Results, showing significant growth in many financial metrics. This blog analyzes and explores the results.
NSE's Key Metrics
Revenue
NSE Group's total revenue in the quarter ending June '24 increased by 47% from INR 3,357 crores to INR 4,950 crores. This significant rise showcases NSE’s ability to generate continuous growth in operations.
Here is a breakdown of NSE’s Revenue
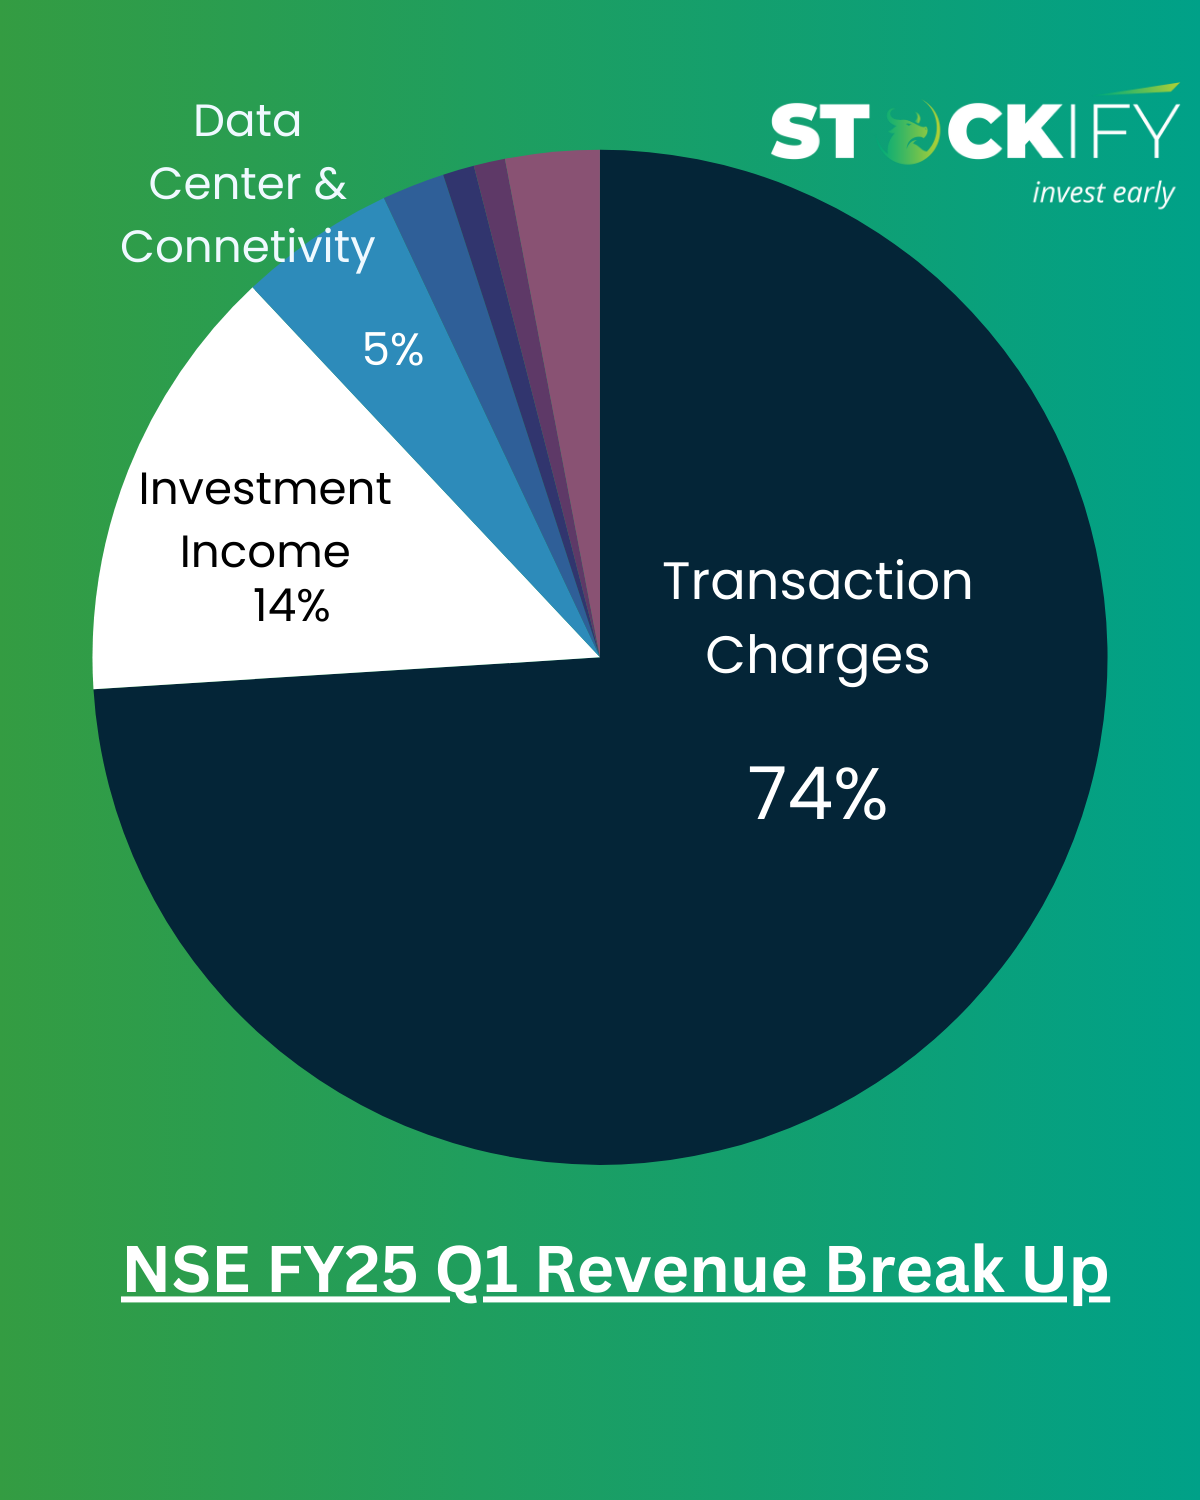
The operating revenue was 91% of the total revenue.
The total consolidated revenue comprises 74% from transaction charges, 14% from investment income, 5% from data center and connectivity charges, 2% from data services, and 1% each from listing and index services.
Expenses
FY 25 Q1 Total Expenses were Rs 943 crores, before contribution to Core SGF Fund. This is 16% more than YoY Rs 826 crore spent in the same year. The YoY total expense including contribution to SGF increased from Rs 857 cr to Rs 1529 crore, which is a massive 78% jump.
This jump in expenses was mainly due to:-
Increase in regulatory fees of Rs 83 crores.
Increased contribution to SGF of Rs 537 crores.
Profit After Tax
The Profit After Tax rose 39% Year on Year from Rs 2568 crore to Rs 1844 crore thus increasing the profitability.
Operating EBITDA
(Without Additional Contribution to Core SGF as desired by SEBI ) : 79% at Rs.11,611 crs (P.Y 81% at Rs.9,631 crs)
(With Additional Contribution to Core SGF as desired by SEBI ) : 67% at Rs.9,870 crs (P.Y 80% at Rs.9,428 crs)
Earnings Per Share
The Year on Year EPS rose to Rs 51.86 per share in FY 25 Q1, from Rs 37.26 per share in the same period last year.
Key Financial Ratios

Source: NSE Website
Net Worth & Book Value
As on 30th June 24, the NSE’s worth was standing at Rs 26,546 cr, as compared to Rs 23,974 cr on March,24. The Book Value per share has also increased from Rs.484 per share in March, 24 to Rs.536 per share in June 24.
Return on Equity
The return on equity increased from 37% in the March quarter to 41% in the June Quarter, hence growing the share value of investors. These positive indicators make NSE unlisted shares a healthy investment to grow your wealth.
Read More: NSE’s Massive Milestone – Crosses 10 Crore Investor Mark.
Is it the right time to buy NSE Unlisted Shares?
The NSE in India is one of the most actively traded shares in the unlisted market. With its recent financial performance and declaring a 4:1 bonus issue, the NSE Share price jumped from Rs 6000-6500 per share. .
NSE pre-IPO stock is the best bet for you if you wish to put your money into stock investment as a retail investor. It is dominating with more than 90% market share in all categories. Compared to BSE, its revenue growth has been three times more than BSE for the last four years.
NSE IPO is in the talks as SEBI looks forward to giving a green flag in 2024. Based on the above data and the comparison, if you buy NSE unlisted shares, count on Stockify. We are one of India’s trusted online stock trading platforms where you can buy and sell unlisted shares in India from the comfort of your home.
Connect with our team to know more.