

Table of Contents
Buy/Sell Your Unlisted Shares
Submit the details below to share a quote.
Parag Parikh Financial Advisory Services (PPFAS) has released its Quarterly Statements for the period ending 31st Dec 2025. With operational revenue increasing 18% quarterly, is this a momentum effect of an increase in Assets Under Management (AUM)? Let's break it down in this blog.
Latest Financial Statements Released
Particulars (in Cr.) | Q3 FY26 (Dec 2025) | Q2 FY26 (Sept 2025) | 9M FY26 Dec 2025 | 9M FY25 Dec 2024 |
Revenue from Operations | 169.35 | 142.99 | 458.71 | 312.6 |
Total Income | 169.4 | 142.99 | 459 | 316.39 |
Total Expenses | 38.29 | 19.21 | 77.15 | 56.75 |
EBITDA (Derived) | 133.34 | 125.79 | 388.12 | 263.95 |
EBITDA Margin (%) | 78.70% | 88.00% | 84.60% | 83.40% |
Profit After Tax (PAT) | 98.63 | 92.74 | 288.82 | 183.97 |
PAT Margin (%) | 58.20% | 64.90% | 62.90% | 58.10% |
EPS - Basic | 127.93 | 120.57 | 374.62 | 239.87 |
EPS - Diluted | 114.13 | 106.67 | 334.23 | 211.73 |
A)Revenue from Operations:
Revenue increased nearly 18.4% on a QoQ basis. This is due to the revenue of the company rising from Rs. 142.99 cr to Rs. 169.35 cr in Q3 FY26 (December 2025).
On the 9 month basis, revenue grew from Rs. 312.60 cr to Rs. 458.71 cr in December 2025. This is reflecting growth of 46.7%, YoY.
B)Total Income:
The total income of PPFAS increased from Rs. 142.99 crore to Rs. 169.40 crore in Q3 FY26. This increase in income was on an 18.5% growth quarterly.
The earnings increase is showing close alignment between total income and revenue from operations, driven by core business activities.
Based on 9 months of financials, total income grew from Rs. 316.39 cr to Rs. 459 cr in 9M FY25. This shows a YoY increase of almost 45.1%. The regularity in sales growth and income helps in the stability and predictability of the company's finances.
C)Total Expenses
The company’s total expenses increased from Rs. 19.21 cr to Rs. 38.29 cr in Q3 FY26.
The expenses are nearly 2x quarterly. This sharp rise is mainly due to higher employee costs and operational investment, which are key to future growth.
The total expense for the 9 months increased from Rs. 56.75 cr. to Rs. 77.15 cr. in December 2025. This shows a roughly 35.9% increase yearly. Most importantly, there is an improvement in cost discipline and operating efficiency.
D)EBITDA
EBITDA is increased by Rs. 124.79 cr to Rs. 133.34 cr in Q3FY26. There is an expected increase of roughly 6% consecutively. This shows strengthening in the operating model of the business. Despite the operating cost rising quarterly, EBITDA kept growing.
While analysing 9 months of EBITDA financials, an increase of around 47% was seen yearly. It was increased from Rs.263.95 cr. to Rs.388.12 cr. in 9M FY26.
E)Profit After Tax (PAT)
PAT climbed up from Rs. 92.74 cr to Rs. 98.63 cr in Q3 FY26. The quarterly gain of almost 6.3% was seen. Hence, profits remain stable despite an increase in operating costs.
On a 9-month basis, PAT increased from Rs.183.97 cr to Rs.288.82 cr in 9M FY26.
This increase shows growth of around 57% yearly.
F)EBITDA Margins
The EBITDA margin decreased from Rs.88% to 78.7% in Q3 FY26. This can be due to higher operating and employee costs every quarter. Additionally, PAT margins decreased from 64.9% to 58.2% sequentially.
Based on 9 months, the EBITDA margin climbed from 83.4% to 84.6% in December 2025.
While the PAT margin increased from 58.1% to 62.9%. This reflects consistent profits and cost control over a period of time.
G)Earnings Per Share (EPS)
EPS grew from Rs. 120.57 to Rs. 127.93 in Q3 FY26, showing roughly 6-7% growth. While diluted EPS jumped from 106.67 to Rs.114.13 per share.
In 9 months of FY26, basic EPS grew from Rs. 239.87 per share to Rs. 374.62 per share in December 2025. While diluted EPS increased to Rs. 334.23 per share from Rs. 211.73 per share, showing a growth of 56% yearly.
Overall, the operations and profit jumped due to a possible increase in Assets Under Management (AUM), creating a healthy financial growth for PPFAS.
PPFAS Revenue Breakdown Analysis
Quarterly, revenue from operations was Rs. 142.99 crore (ended in Sep Q2, FY26). Now, let's break it down:
Interest Income is Rs.0.22 cr
Fees and commission income are Rs 139.98 cr
Net gain on fair value changes is Rs. 2.77 cr.
On the other hand, operations generated in the June 2025 quarter gave Rs. 146.38 crore revenue, with Rs.0.10 crore in interest income, Rs. Rs.117.85 crore in fees and commission income and Rs.28.42 crore in fair value gains.
9 Month Comparison (FY 25 VS FY 26)
The overall revenue from operations for the nine months ended in September 2025 was Rs. 289.36 crore, up from Rs. 214.44 crore for September 2024, rising by 35% YoY.
Fees and commission income of Rs.257.84 crore, fair value gains of Rs.31.20 crore, and interest income of Rs.0.33 crore were the primary factors of the nine-month revenue.
By contrast, fees and commission income were Rs. 163.07 crore, fair value gains were Rs. 51.30 crore, and interest income was Rs. 0.07 crore in the prior year, indicating a significant spike in core advisory income.
How Has Parag Parikh Unlisted Share Performed?
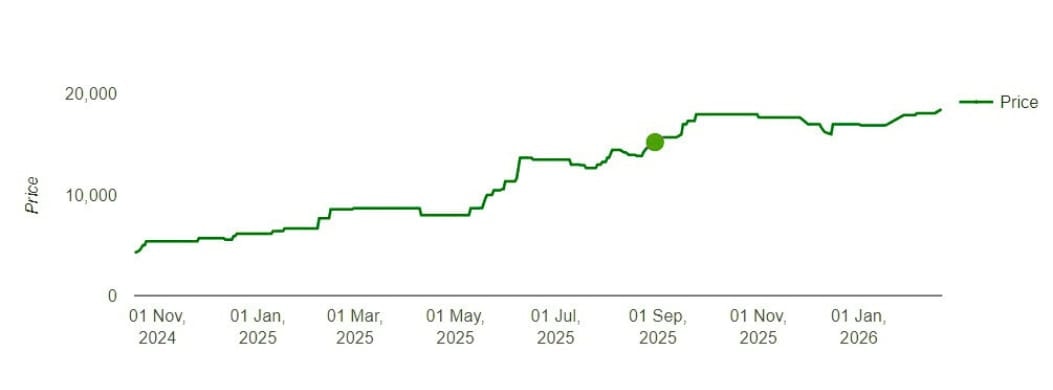
The Parag Parikh unlisted share price has increased sharply from Rs. 8555 to Rs. 18,500 per share. The increasing growth showed an appreciation of 115-120% in a single year.
The current price is roughly Rs. 18,900.
In terms of valuation, P/E is about 56-58x, which is higher than industry standards, where P/E is roughly 35x. This premium valuation might show investors' confidence.
With a market capitalisation of roughly Rs. 14000-Rs. 14500 cr, the company is positioned in the mid-cap segment of the financial services sector. Hence, reflecting its growing scale within the industry.
The company has followed a steady dividend payout approach. In FY24, the company declared a dividend of Rs. 8.6 per share. While in FY25, the company announced a higher dividend of Rs. 15 per share. This approach shows that the company focuses on rewarding shareholders along with business growth.
Is the PPFAS IPO near?
According to Money Control, Parag Parikh Financial Advisory Services is considering a potential stock market listing around 2030, with the timing largely aligned to the vesting of its final tranche of employee stock options, according to CEO Neil Parikh.
He said listing the company before ESOPs fully vest could lead to a significantly higher tax burden for employees, especially if the shares list at a premium, as employees are currently taxed based on the book value of shares while the company remains unlisted. Parikh added that the proposed timeline is indicative and flexible, stressing that the firm is in no rush to go public and will consider an IPO only when it makes strategic and operational sense.
You may also like to read

What Are The Different Classes Of Shares Issued In India?

Different Classes of Assets In The Financial Market

Follow These Simple Share Market Tips While Investing

Importance of Investing in Unlisted Shares

Pre IPO Success Stories To Start Your Unlisted Share Trading

Step-by-step Process Of Transferring Unlisted Shares (Off-market)

What Is The Expected Return Of Unlisted Shares?

Common Mistakes To Avoid While Investing In Unlisted Shares

Know Your Tax Implications Before Investing In Unlisted Shares

How To Pick Best Performing Unlisted Stocks in India?

A Detailed Guide On How To Buy Unlisted Shares In India

Risks And Rewards Associated With Unlisted Share Investment

Difference Between Start-Up Investing And Unlisted Shares?

IPO Process in India: Key Steps Explained Clearly

Revealed: The Real Picture of Unlisted Shares in Grey Market

Key Financial Ratios And How To Use Them To Analyse Your Investment

10 Golden Rules Of Investing In Stock Market

101 Guide For Beginners: What Is Pre IPO Share Market?

Listed Shares Vs. Unlisted Shares - Detailed Comparison

The Dark Side of Paytm's IPO Explained In Details

What Leads to Delisting of Shares and What Goes Behind The Scenes?

When Should You Review Your Portfolio Professionally?

In-Depth Analysis of Pre-IPO Shares for Portfolio Growth

PharmEasy Unlisted Price Falls 70%. Here's why

Delaying Pre-IPO Investments? Here’s What You Risk

An NRI’s Guide To Invest In Unlisted Shares In India

Guide To Filter The Most Profitable Unlisted Companies In India

A Comprehensive Guide On Follow-on Stocks

Smart Strategy to Buy & Sell Unlisted Shares Professionally

Care Health Insurance

Top Highly Profitable Unlisted Companies In India To Look For As An Investor

Upcoming IPOs In 2022-2023

Capgemini Unlisted Shares: Is The Risk Worth?

Expert’s Driven Roadmap To Research A Startup IPO

HDFC Sec vs HDB Financial: Which Is the Better Pick?

Detailed Guide To Calculate Capital Gains on Unlisted Shares

Dematerialisation of Unlisted Shares and Its Impact On Shareholders

How are B9 Beverages Pvt Ltd (Bira91) Unlisted Shares Gaining Pace Again?

Reliance Retail: The Success Story of India's Largest Retail Brand

The Future Of Unlisted Shares In the Fintech Market
Employee Stock Ownership Plan: What, How, and Why?

Studds Unlisted Shares: 6 Reasons to Buy Now

LAVA’s Unlisted Shares Soar Under Atmanirbhar Push

NSE vs BSE: Detailed 101 Market Share Comparison

The Role Of Corporate Governance And Management In Unlisted Companies

The Future Outlook For Unlisted Shares As An Investment Option

How to Buy and Sell Unlisted Shares in India?

The Benefits And Drawbacks Of Investing In Unlisted Shares

What's Temperature Ahead Of Tata Technologies' ₹4,000 Cr. IPO?