
1.jpg)
Table of Contents
Buy/Sell Your Unlisted Shares
Submit the details below to share a quote.
Transline Technologies Limited (TTL) operates in the IT and surveillance solutions space, offering services like CCTV systems, biometrics, and integrated digital infrastructure. Over the years, it has built a presence across sectors such as telecom, transportation, and government projects, positioning itself as a growing player in India’s security and tech solutions market.
Recently, Transline has delivered strong revenue and profit growth, supported by rising demand for digital surveillance and smart infrastructure. However, alongside this growth, the company is also seeing shifts in margins and cash flow, making its financial performance worth a closer look. Let’s break down Transline Technologies financials.
Transline Technologies Annual Report Analysis
Particulars (Rs. in Cr.) | FY23 | FY24 | FY25 |
Revenue | 11.4 | 22.6 | 37.1 |
Expenses | 10.7 | 17 | 31.3 |
EBITDA | 1.4 | 5 | 7.6 |
PAT | 1 | 3.5 | 4.8 |
EPS | 13.25 | 21.88 | 26.95 |
EBITDA Margin | 12% | 22.30% | 20.40% |
Net Margin | 8.80% | 15.70% | 13% |
Revenue
The Transline Technologies financials show that revenue has grown sharply from Rs.11.4 Cr in FY23 to Rs.37.1 Cr in FY25. This reflects a strong growth of nearly a 225% increase in two years. The growth in FY24 was 98% and 64% in FY25. This data likely shows that the 64% revenue growth in FY25 is due to rising demand and strong business expansion.
Expense
Expenses increased from Rs.10.7 Cr to Rs.31.3 Cr. This shows a growth of 192%. While costs are rising, they are still growing more slowly than revenue, indicating better cost control and operating leverage.
EBITDA
EBITDA increased from Rs.1.4 Cr to Rs.7.6 Cr in FY25. It's showing a massive 443% growth in two years. Margins expanded sharply by 22.3% in FY24 but slightly increased to 20.4% in FY25. This suggests that while profitability is strong, cost pressures are likely starting to show at scale.
Profit After Tax (PAT)
PAT increased from Rs.1.0 Cr to Rs.4.8 Cr in FY25. It's delivering a solid 380% growth in 2 years. However, growth might slow in FY25 compared to FY24, indicating that there might be stabilisation in business after an expansion
Earnings Per Share (EPS)
EPS doubled from Rs.13.25 to Rs.26.95 in FY25. Hence, a 103% growth can be observed, which might reflect improved shareholder value
EBITDA Margin and Net Margins
EBIDA Margin improved significantly from 12% in FY23 to 22.3% in FY24, then dipped slightly to 20.4% (FY25). Net Margin is increased from 8.8% to 13% but declined from the peak of 15.7% in FY24. This figure can indicate that while profitability has structurally improved, recent pressure on margins likely suggests higher costs or aggressive expansion spending. Overall, Transline Technologies financials analysis shows a likely high-growth phase, with strong gains in revenue and profits.
Transline Technologies Cash Flow Analysis
Particulars (in Rs. Cr.) | FY24 | FY25 |
Operating Cash Flow | 164.8 | -16.5 |
Investing Cash Flow | -7 | -13.2 |
Financing Cash Flow | -1 | -9.9 |
Net Cash Flow | 156.8 | -39.7 |
Operating Cash Flow
In FY24, the company generated Rs. 164.8 Cr in operating cash, but it slipped into a negative Rs. 16.5 Cr in FY25. This clearly shows that while profits are growing on paper, the actual cash flow may not be coming in at the same pace. Most likely, money is getting stuck in receivables or working capital, which might be common in fast-growing companies.
Investing Cash Flow
The company is spending more on investments, with outflows increasing from -Rs. 7 Cr to Rs. -13.2 Cr in FY25. This might not be a negative sign. In fact, it likely means the business is expanding, investing in assets, or building future capacity. It can align well with the strong growth seen in revenue and assets.
Financing Cash Flow
Financing outflows have also gone up, from Rs.1 Cr to Rs.9.9 Cr in FY25. This suggests the company might be either repaying debt, managing obligations, or adjusting its funding structure. While reducing debt can be positive, higher outflows also likely put pressure on overall liquidity.
Net Cash Flow
Net cash flow has moved from a healthy Rs. 156.8 Cr in FY24 to negative Rs. 39.7 Cr in FY25. This sharp swing might reflect a clear gap between profitability and actual cash generation. The business is profitable, yet cash-strained, likely due to working capital pressure and higher outflows.
Transline Technologies Balance Sheet Analysis
Particulars (in Rs. Cr) | FY23 | FY24 | FY25 |
Current Assets | 7.4 | 19.8 | 37.8 |
Total Assets | 8.5 | 21.9 | 39.7 |
Total Equity | 3 | 8.4 | 17.9 |
Total Liabilities | 5.5 | 13.6 | 21.9 |
Transline Technologies balance sheet likely reflects a fast-scaling business. Total assets increased from Rs. 8.5 Cr in FY23 to Rs. 39.7 Cr in FY25, which can be driven by a sharp rise in current assets, indicating higher working capital deployment.
On the positive side, Total Equity has strengthened significantly, with reserves growing to Rs. 16.1 Cr and total equity reaching Rs. 17.9 Cr in FY25, showing strong internal value creation.
However, total liabilities have also increased sharply, especially current liabilities (Rs. 21 Cr), which might be due to working capital pressure. The debt-to-equity ratio of 1.20 might remain moderate, but it reflects reliance on external funding.
Also Read: Transline Technologies Business Model, Clients & Growth Projections
Transline Technologies Unlisted Share Overview
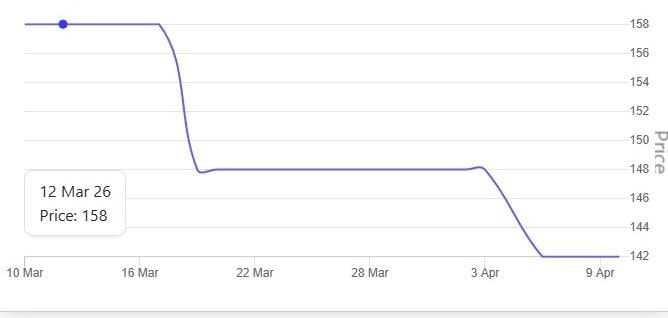
Transline Technologies unlisted share was trading around Rs. 158 on 12th March. However, April saw a correction, and the stock is currently trading around Rs. 152.25. The market cap of Transline Technologies is Rs. 1,366 Cr. At this level, the market likely values the company as a high-growth player in the IT and surveillance space.
Looking at valuations, the stock trades at a P/E of 28x and a Price-to-Sales of 3.7x. The Transline Technologies financials show strong revenue growth (Rs. 11.4 Cr to Rs. 37.1 Cr in 3 years) and improving profitability. The ROE of 27% shows there can be efficient use of capital.
You may also like to read

What Are The Different Classes Of Shares Issued In India?

Different Classes of Assets In The Financial Market

Follow These Simple Share Market Tips While Investing

Importance of Investing in Unlisted Shares

Step-by-step Process Of Transferring Unlisted Shares (Off-market)

Pre IPO Success Stories To Start Your Unlisted Share Trading

What Is The Expected Return Of Unlisted Shares?

A Detailed Guide On How To Buy Unlisted Shares In India

Know Your Tax Implications Before Investing In Unlisted Shares

Common Mistakes To Avoid While Investing In Unlisted Shares

How To Pick Best Performing Unlisted Stocks in India?

Risks And Rewards Associated With Unlisted Share Investment

Difference Between Start-Up Investing And Unlisted Shares?

IPO Process in India: Key Steps Explained Clearly

Revealed: The Real Picture of Unlisted Shares in Grey Market

Key Financial Ratios And How To Use Them To Analyse Your Investment

101 Guide For Beginners: What Is Pre IPO Share Market?

10 Golden Rules Of Investing In Stock Market

Listed Shares Vs. Unlisted Shares - Detailed Comparison

The Dark Side of Paytm's IPO Explained In Details

What Leads to Delisting of Shares and What Goes Behind The Scenes?

When Should You Review Your Portfolio Professionally?

In-Depth Analysis of Pre-IPO Shares for Portfolio Growth

PharmEasy Unlisted Price Falls 70%. Here's why

Delaying Pre-IPO Investments? Here’s What You Risk

An NRI’s Guide To Invest In Unlisted Shares In India

Guide To Filter The Most Profitable Unlisted Companies In India

A Comprehensive Guide On Follow-on Stocks

Care Health Insurance

Smart Strategy to Buy & Sell Unlisted Shares Professionally

Top Highly Profitable Unlisted Companies In India To Look For As An Investor

Upcoming IPOs In 2022-2023

Expert’s Driven Roadmap To Research A Startup IPO

Capgemini Unlisted Shares: Is The Risk Worth?

HDFC Sec vs HDB Financial: Which Is the Better Pick?

Detailed Guide To Calculate Capital Gains on Unlisted Shares

Dematerialisation of Unlisted Shares and Its Impact On Shareholders

How are B9 Beverages Pvt Ltd (Bira91) Unlisted Shares Gaining Pace Again?

Reliance Retail: The Success Story of India's Largest Retail Brand

The Future Of Unlisted Shares In the Fintech Market
Employee Stock Ownership Plan: What, How, and Why?

Studds Unlisted Shares: 6 Reasons to Buy Now

LAVA’s Unlisted Shares Soar Under Atmanirbhar Push

NSE vs BSE: Detailed 101 Market Share Comparison

The Role Of Corporate Governance And Management In Unlisted Companies
What's Temperature Ahead Of Tata Technologies' ₹4,000 Cr. IPO?

The Future Outlook For Unlisted Shares As An Investment Option

How to Buy and Sell Unlisted Shares in India?

The Benefits And Drawbacks Of Investing In Unlisted Shares