1.jpg)

Nestle India Q4 FY26 results declared on April 20, 2026 fall firmly in the second category. The FMCG heavyweight delivered a net profit of ₹1,114 crore. It is a jaw-dropping 26% jump year-on-year that left consensus forecasts scrambling to catch-up.
Revenue from operations surged in 22.6% to ₹6,748 crore. It is a figure that, just six months ago, would have been considered optimistic even as a full-year target.
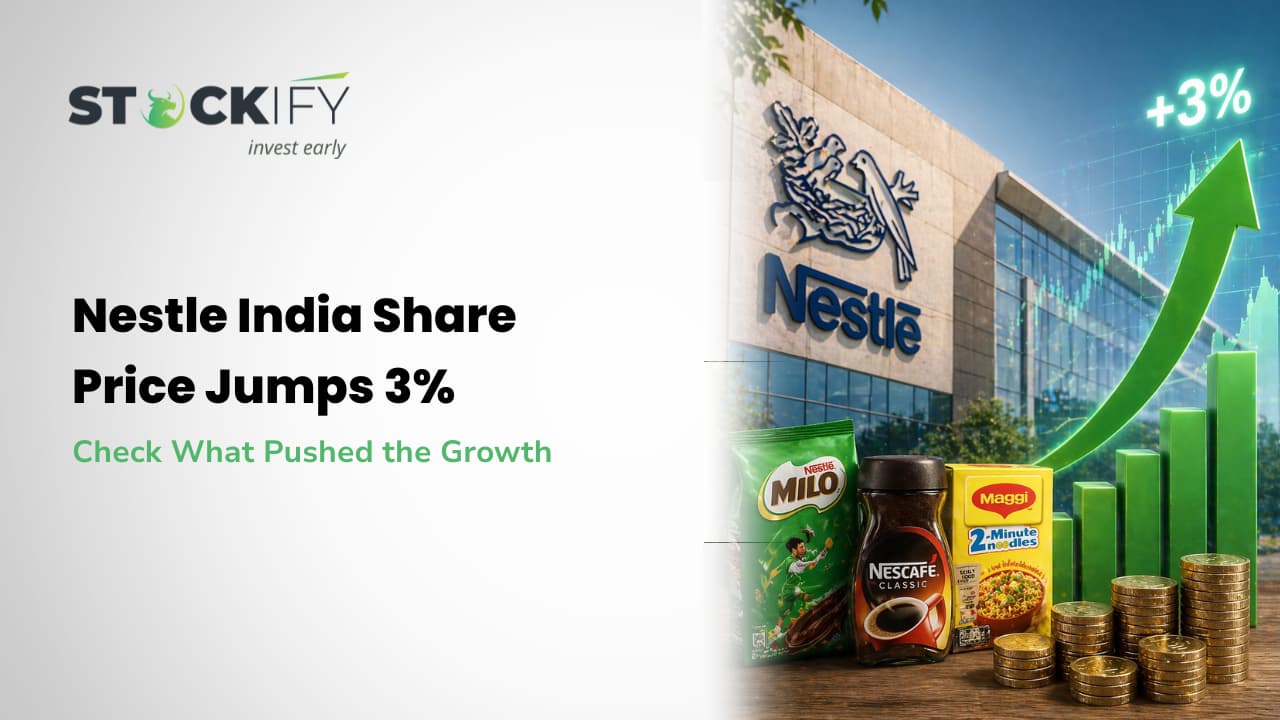
The market reacted swiftly and decisively. The Nestle India share price shot up as much as 8.5% intraday on April 21, 2026, touching an all time high of ₹1,396 on the NSE. This is the level the stock has never seen. Even after some profit-booking trimmed the gains, the stock extended its rally the following day, just a confirmation for the market’s conviction.
Let us read the blog to know more about Nestle India share price movement.
Nestle India Share Price: Where Does the Stock Stand Today?
Parameter | Value (NSE) |
Current Price | ₹1,299.00 |
Day High | ₹1,315.35 |
Day Low | ₹1,287.40 |
52-Week High | ₹1,340.40 |
52-Week Low | ₹1,085.00 |
All-Time High | ₹1,389.00 |
Market Capitalisation | ₹2,50,295 Crore (~₹2.5 Lakh Crore) |
TTM PE Ratio | 76.76x |
Sector PE | 67.40x |
Dividend Yield | 2.08% |
Book Value Per Share | ₹28.28 |
P/B Ratio | 45.90x |
Face Value | ₹1 per share |
Upper Circuit Limit | ₹1,415.00 |
Lower Circuit Limit | ₹1,157.80 |
Promoters- Nestle S.A. and Maggi Enterprises Limited holding of 62.76% strengthens the presence of the company.
Key Financial Highlights
Here are the key financial highlights for Nestle.
Metric | Q4 FY26 (Actual) | Q4 FY25 | YoY Change |
Net Profit | ₹1,114 Crore | ₹884 Crore | +26.0% |
Revenue from Operations | ₹6,748 Crore | ₹5,504 Crore | +22.6% |
Domestic Sales | ₹6,445 Crore | ₹5,235 Crore | +23.1% |
Export Sales | ₹303 Crore | ₹269 Crore | +12.6% |
EBITDA | ₹1,772 Crore | ₹1,389 Crore | +27.6% |
EBITDA Margin | 26.3% | 25.2% | +110 bps |
EPS (Basic) | ₹5.78 | ₹4.59 | +25.9% |
Final Dividend Declared | ₹5 per share | ₹3.50 per share | +42.9% |
Full Year FY26 Snapshot
Metric | FY26 | FY25 | YoY Growth |
Full Year Revenue | ~₹24,850 Crore | ~₹19,900 Crore | ~+24.9% |
Full Year Net Profit | ~₹3,850 Crore | ~₹3,050 Crore | ~+26.2% |
Full Year EBITDA Margin | ~25.8% | ~24.5% | +130 bps |
What Powered the Growth for Nestle India?
Here is why we see a good growth for Nestle India share price:
1. Double Digit Volume Growth
Nestle India delivered double-digit volume growth in Q4 FY26, a feat rarely seen among large-cap FMCG companies and one that fundamentally changes the company’s narrative. The volume growth was broad-based, not concentrated on one category, which makes it all the more impressive.
2. 50% Surge in Advertising Spends:
Nestle India made a bold strategic bet in FY26. The company increased advertising and promotional (A&P) spends by over 50% year on year. Ultimately the market share gained across multiple categories. It is surprising because Nestle has always been conservative about advertising.
3. Premiumisation and Rural Market Capture:
The company is pushing premium and super premium variants, higher ASPs that expand margins. In smaller towns and rural markets, it is widening distribution and launching affordable entry-price packs to capture the first time buyers. This dual track strategy is the next volume engine for FMCG companies.
4. Margin Expansion Despite Heavy Investment:
Perhaps the most impressive elements of the Q4 results was that the EBITDA margin expanded to 26.3%, even as the company spent 50% more on advertising. This reflects extraordinary operating leverage: fixed cost absorption became better and there were not many incremental costs.
Raw material costs, particularly milk and wheat derivatives remained stable in Q4.
About Nestle India: A Legacy Brand with a 21st Century Playbook
Nestle India is a world's largest food and beverage company by revenue. It was founded in1866 by Henri Nestle. The Indian Business was incorporated in 1956 and since then it is 7 decades of the brand spent to increase its credibility.
Nestle makes different products varying from Milk, Slim milk, Iced-tea, Cappuccino, Cerelac, Lactogen, Maggi and others. The company has its headquarter in New Delhi.
Technical Analysis: Key Price Levels
For investors and traders it is important to see this:
Level | Price | Significance |
All-Time High | ₹1,389.00 | Strong resistance; breakout above this is bullish |
52-Week High | ₹1,340.40 | Immediate resistance |
Current Price | ₹1,299.00 | As of April 22, 2026 |
Upper Circuit Limit | ₹1,415.00 | Max daily upside |
Lower Circuit Limit | ₹1,157.80 | Max daily downside |
52-Week Low | ₹1,085.00 | Strong long-term support |
Short-Term Support | ₹1,250–₹1,260 | Key demand zone |
Conclusion
Nestle India has one of the most consistent dividend payment records in the Indian FMCG sectors. The company declared a final dividend of ₹5 per share for FY26, a jump of 42.9% over the FY 25 final dividend of ₹3.50 per share.
The current dividend yield for Nestle India share price is 2.08%, which is meaningful for the growth stock with strong capital appreciation potential.
FAQ
What is the Nestle India share price today?
The approximate price of Nestle India share is ₹1,299 on NSE.
How much profit was booked for Nestle India Q4 FY26 results?
The net profit of ₹1,114 crore was booked which is 26% Y-o-Y growth straight
Why did Nestle India share price jump 3-8% ?
Nestle India rallied sharply because there was an increase in profit, revenue, margins, and volumes.