NCL Buildtek Limited Unlisted Shares
About The Company
Strong
Market Position
Consistent
YoY Growth
Experienced
Management
Key Indicators
A snapshot of NCL Buildtek Limited Unlisted Shares's financial health, valuation multiples and capital efficiency at a glance.
Pricing Trends
Financial Performance
| Indicators | 2025 | 2024 | 2023 | 2022 | 2021 | 2020 | 2019 | 2018 |
|---|---|---|---|---|---|---|---|---|
| Revenue | 406.2 | 437.0 | 453.1 | 408.3 | 266.0 | 285.9 | 373.9 | 259.0 |
| Expense | 369.4 | 386.7 | 406.9 | 384.7 | 248.5 | 250.8 | 314.4 | 220.3 |
| EBITDA | 36.7 | 50.3 | 46.2 | 23.6 | 17.5 | 35.1 | 59.5 | 38.7 |
| Other Cost | -21.3 | 26.6 | 27.7 | 12.3 | 23.0 | 15.5 | 11.4 | -28.6 |
| PBT | 58.0 | 23.7 | 18.5 | 11.3 | -5.5 | 19.6 | 48.1 | 67.3 |
| Tax Expense | 13.9 | 7.3 | 5.0 | 3.2 | 1.2 | 2.4 | 17.2 | 16.4 |
| PAT | 44.1 | 16.4 | 13.5 | 8.1 | -6.7 | 17.2 | 30.9 | 50.9 |
| Other Inc./Exp. | -2.0 | 8.4 | 6.4 | 3.6 | 0.8 | 2.5 | 0.7 | 1.4 |
| Net Income | 42.2 | 24.8 | 19.9 | 11.7 | -5.9 | 19.7 | 31.6 | 52.3 |
| Shares O/S | 1.16 | 1.20 | 1.20 | 1.20 | 1.20 | 1.20 | 1.20 | 1.20 |
| EPS (₹) | 7.55 | 21.00 | 16.70 | 10.10 | -5.10 | 17.10 | 27.50 | 45.50 |
| Rev. Growth % | -7.0% | -3.6% | 11.0% | 53.5% | -7.0% | -23.5% | 44.4% | — |
| EBITDA Mgn % | 9.0% | 11.5% | 10.2% | 5.8% | 6.6% | 12.3% | 15.9% | 14.9% |
| Net Mgn % | 10.4% | 5.7% | 4.4% | 2.9% | -2.2% | 6.9% | 8.5% | 20.2% |
| EPS Growth | -64.0% | 25.7% | 65.3% | -298.0% | -129.8% | -37.8% | -39.6% | — |
Registered Address
Management Team
Download Financial Results

From The Experts
Top Unlisted companies


Frequently Asked Questions
Still have questions?
Our expert team typically responds within 30 minutes during market hours.
About NCL Buildtek Limited Unlisted Shares
NCL Buildtek Limited, formerly known as Alltek and Seccolor, is part of the NCL group, which has a presence in various sectors. It offers construction and building materials, including Wall Paints, Windows, Putties, etc. With over 30 years of experience, NCL Buildtek has completed various projects and is the sole licensee in India for ICP plasters.
It was incorporated in 1986 and became India's first company to manufacture acrylic and texture paint. The company has a strong presence in various regions, including Hyderabad, Ghaziabad, Pune, Rajasthan, Medak, Visakhapatnam, etc. If you plan to invest in this company, this page will provide detailed insights into NCL Buildtek Limited share price, financial performance, business model, and more.
NCL Buildtek Limited is one of India's leading construction material and services providers. It provides various manufacturing materials like AAC blocks, tile adhesives, windows and doors, wall coating, and many more. The company is a part of the NCL group, which is a ₹3000 crore group. This means that the company has good backing with a well-established business.
Business Model Of NCL Buildtek Limited
The business model of NCL Buildtek comprises its various business segments through which it earns revenue and caters to the needs of different types of customers. It has three business verticals: NCL doors and windows, NCL coating, and NCL wall solutions.
NCL Coatings
The coatings division contributes 25% of the total sales of NCL Buildtek in India. The company has collaborated with ICP Sweden to manufacture wall textures, putties, and emulsion paints.
NCL Wall Solutions
NCL Buildtek Limited manufactures dry-mixed cement mortars, AAC blocks, and various tile adhesives in the wall solutions business segment. The wall solutions contribute 25% of the total turnover of the company.
NCL Windows & Doors
NCL Buildtek Limited collaborated with Veka AG (Germany), SCHUGO (Germany), and KOS (South Korea) to manufacture a wide range of partitions, glazing, uPVC doors, pre-painted steel doors, windows & ABS doors, etc. This business segment contributes 50% of the total turnover of the company.
What is the new name of NCL Buildtek?
The new name of NCL Buildtek is NCL Buildtek Limited. This change was officially announced in 2023 as part of the company's rebranding strategy. Formerly, it was known as NCL ALLTEK & SECCOLOR LTD.
Analysis of NCL Buildtek Limited Financial Performance
According to the report of Mordor Intelligence, the Indian paints and coatings market size in 2023 is USD 8.78 billion. It is expected to reach USD 13.75 billion by 2028.
Being a prominent industry player, NCL Builtek Limited continues targeting new regions via its business segments. In the last few years, NCL managed a positive growth rate, also reflected in NCL Buildtek Limited unlisted shares traded in the market. Let's look at their financial performance
Particulars | FY 2024-2025 | FY 2023-2024 |
Gross Revenue / Net Revenue | ₹ 404 cr | ₹ 435 cr |
EBITDA | ₹ 34 cr | ₹ 49 cr |
Net Income | ₹ 44 cr | ₹ 27 cr |
EPS | ₹ 23 | ₹ 38 |
Talking about the financial performance, NCL Buildtek recorded a growth in its revenue from INR 450 crore in FY23 & INR 435 crore in FY24.
In FY 25, NCL witnessed a 7.1% decline in revenue (₹31 crore), indicating potential weakness in core operations, likely due to lower volumes or sales. This drop can signal deteriorating business fundamentals, which negatively impact NCL Buildtek share price.
EBITDA declined significantly from ₹49 crore to ₹34 crore, representing a 31% decrease, with margins compressing from approximately 11.26% to 8.42%. This reflects reduced operational efficiency and possible competitive pressures, further weighing on the stock's valuation, putting negative pressure on the NCL Buildtek Limited share price.
Interestingly, net income increased despite lower revenue and EBITDA. This suggests the company can temporarily boost its profit. However, such gains may not be sustainable and are unlikely to support long-term share price growth.
Meanwhile, EPS dropped sharply by 39.5%, from ₹38 to ₹23, despite the rise in net income. This discrepancy implies that the profit increase isn’t translating into shareholder value. Given that EPS is a key valuation metric, this decline may lead to a de-rating of NCL Buildtek Ltd share price.
As a result, NCL Buildtek Limited share price grew and didn't show much fluctuation. In terms of financial performance, the company emerged as profitable from an investment perspective.
What is the revenue of NCL Buildtek?
Looking at year-over-year metrics, despite a revenue decrease from Rs. 453 crore in March 2023 to 323 crore in December 2023, the company maintained relatively stable profitability metrics. In FY 24 and 25, the revenue declined from Rs 435 crore to Rs 404 crore, respectively.
What is the financial condition of NCL?
The EBITDA has remained strong at 37 crore compared to 46 crore in March 2023 and notably higher than Rs 23 crore in March 2022. But it decline in FY 24 and FY 25, ending up to Rs 34 crore Most importantly, the Earnings Per Share (EPS) improved to 18 in December 2023 from 17 in March 2023 and 10 in March 2022, indicating enhanced profitability on a per-share basis despite lower revenue.
FY 2024 saw an improvement in EPS to Rs 38 per share, but by FY 25, EPS declined again to Rs 23 per share.
NCL Buildtek Limited Share Price Analysis
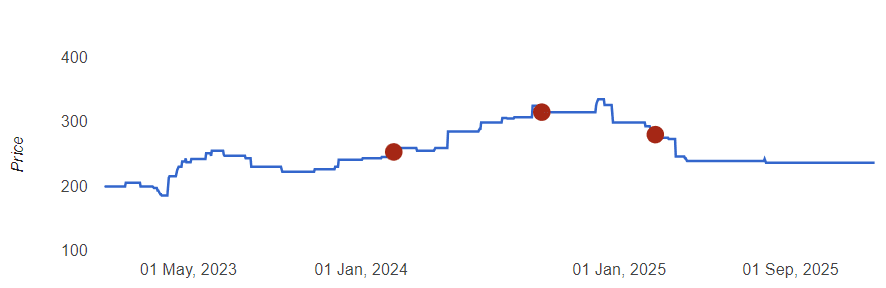
In recent years, NCL Buildtek Limited has performed very well in the unlisted share market. If we talk about its unlisted share price, it has been quite promising. NCL Buildtek Limited had a share price of ₹199 in January 2023, which went up to ₹244 in December 2023.
· A strong upward trend is shown in price during the period 2023 to 2024, which rallied up NCL Buildtek share price from 195 to 270+, which might be driven by Positive market sentiment and valuation re-rating backed up by Strong FY 2023–24 performance.
· Despite net income increasing in FY 2024–25, the share price declines in this period from 270 to 235, turning investors cautious, signalling a shift in sentiment from growth optimism to caution, which is reflected in the NCL Buildtek Ltd share price.
One of the major reasons for this is the fact that the company has some good financials. This ensures that investors have trust in the brand.
Why Buy NCL Buildtek Limited Unlisted Shares
Like every company, NCL Buildtek Limited also has its strengths and weaknesses. Being an investor, you should be familiar with it.
Strength
The company offers sustainable products and services while emphasising customer satisfaction.
NCL products have been accepted by various state governments and incorporated in state SORs in the past 18 years.
It has business operations in 11 different states of India.
Weakness
NCL Buildtek Limited recorded a decline in gross profit margin by 45% due to the high cost of raw materials.
It operates in a highly competitive industry.
The company is facing some liquidity issues.
Check NCL Buildtek Limited Share Price On Stockify
NCL Buildtek Limited is one of the fastest-growing companies performing exceptionally in the unlisted share market. Its pre-IPO shares remain in high demand among retail investors. However, various investors struggle to check an accurate NCL Buildtek share price in India. You will get the current share price of NCL Buildtek on Stockify. Our team of unlisted share brokers updates the unlisted share price based on current market conditions. Check NCL Buildtek Limited stock price on Stockify!
Check Out Other Unlisted Shares Price On Stockify
Are you looking for top-performing unlisted companies for investment? Get complete details of companies, including their financial performance, unlisted share price, and market valuation. At Stockify, you can start investing in trending unlisted shares hassle-free. Our team of unlisted share brokers will guide you with each step.
