

TL;DR:
Assets Under Custody up 18.2% YoY to Rs.1,68,492 Cr, but consolidated revenue down 12.27% to Rs.487.92 Cr.
EBDespite the revenue drop, ITDA margin jumped to 76.04% (standalone: 77.68%), lifting PAT ~2.5% to ~Rs.209.8 Cr.
ROE to 20.96% and ROCE fell to ~33.51% indicating that capital efficiency lagged profit growth.
Debt-to-equity at 0.00x; Ashish Kacholia has a 7.57% stake.
What Orbis Financial FY26 Results Does and Why FY26 Matters
Orbis Financial Corporation is a SEBI-registered custodian and market infrastructure company that safe keeps and services assets for foreign portfolio investors (FPIs), alternative investment funds (AIFs), portfolio management services (PMS), mutual funds, and institutional clients across roughly 30 countries. It doesn't manage money or take market risk directly, it earns fees for custody, clearing, depository, fund accounting, RTA, and trusteeship services, and it also earns treasury/float income on client margin deposits parked with it.
That business mix matters because it explains almost everything unusual in the FY26 numbers (year ended 31 March 2026, compared against FY25). On the surface, revenue fell double digits. But under the surface, margins expanded, profit still grew, and the custody franchise itself, measured by AUC, kept scaling.
Orbis Financial Corporation Ltd Share Price
Source: Stockify
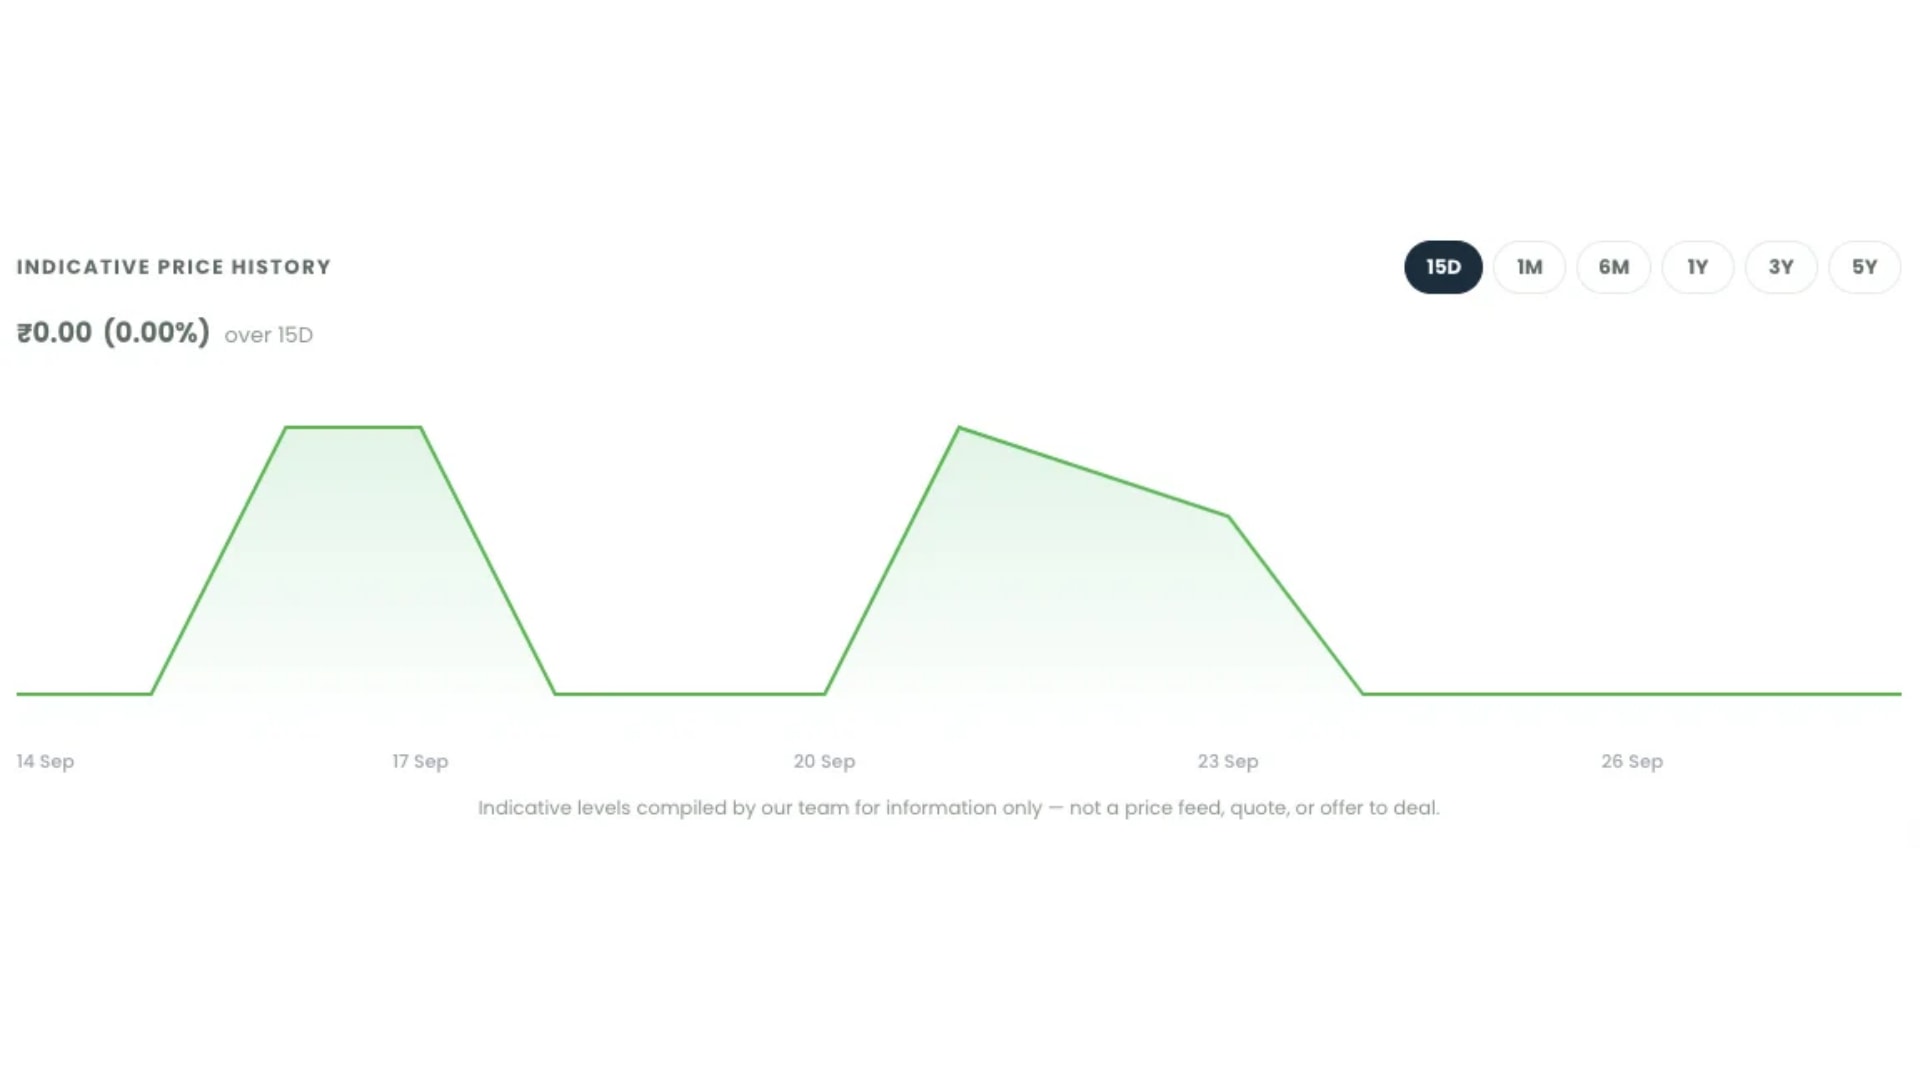
Orbis Financial’s indicative share price is likely to remain range-bound, as strong AUC growth, higher EBITDA margin and stable profit are offset by falling revenue and weaker ROE and ROCE.
The Headline Numbers: What Improved
Orbis Financial's FY26 performance shows a business converting a smaller revenue base into stronger profitability, even as some capital-efficiency metrics cooled.
Metric | FY 25 | FY 26 | Change |
AUC (Rs. Cr) | 1,42,569 | 1,68,492 | +18.2% YoY |
PAT (Rs. Cr) | ~204.58-204.63 | ~209.70-209.88 | +2.47-2.59% YoY |
EBITDA margin (consolidated) | 67.47% | 76.04% | +857 bps |
EBITDA margin (standalone) | 68.20% | 77.68% | +948 bps |
Debt-to-equity | 0.00x | 0.00x | Unchanged |
Net worth (Rs. Cr) | 899.64 | 1,100.67 | +22.3% YoY |
AUC growth signals continued expansion of the underlying custody franchise, while the sharp EBITDA margin gain reflects a marked cut in operating costs. Net worth growth was driven by profit accretion and continued equity/ESOP issuances, keeping the balance sheet virtually debt-free.
What Slipped: Revenue & Return Ratios
Not all metrics went the same way and these are the ones to watch closely.
Revenue fell 12.27% YoY on a consolidated basis, from Rs.556.16 Cr in FY25 to Rs.487.92 Cr in FY26. Standalone revenue from operations dropped from Rs.551.38 Cr to Rs.482.72 Cr, a decline of roughly 12.5%.
ROE slipped from roughly 22.75–23% to 20.96%, meaning the company generated a lower return on shareholder equity even as absolute profit rose, largely because net worth grew faster than profit.
ROCE fell from 41.04% to around 33.51-33.52%. A significant contraction which indicates that the capital employed is growing faster than the returns earned on it.
Why Did Orbis Financial FY26 Revenue Fall While Profit Still Grew?
This is the part the headline numbers don't explain on their own, and it's the most important nuance for anyone analysing the FY26 report.
Roughly 60% of Orbis Financial's revenue historically comes from float income, interest earned on client margin and exposure deposits parked with the company, rather than from service fees.
In FY26, interest income on bank deposits fell as yields compressed during a softer rate cycle, even though the underlying float itself grew.
At the same time, custody fee income declined sharply, and a large drop in "commission fee" expenses in the same period suggests that a distribution or referral arrangement was either discontinued or restructured to a net basis, meaning some of the revenue decline is presentational rather than a sign of a shrinking client base.
Total expenses fell even faster than revenue during the year. That combination, revenue down, but costs down by more, is precisely why the EBITDA margin and PAT both improved despite a smaller top line. It's a classic case where headline revenue and headline profitability tell different stories, and a reader who only sees "revenue fell" without this context would misread the quarter.
The Ashish Kacholia Angle
Adding to investor interest in Orbis Financial is its shareholder register: high-profile individual investor Ashish Kacholia holds a 7.57% stake in the company, alongside promoter Atul Gupta (21.15%) and other backers such as Plutus Wealth Management LLP (6.01%).
Kacholia first invested in Orbis Financial in a funding round of roughly Rs.111 crore, followed by a second round of about Rs.102 crore, both advised by Derivative Saint. His continued presence on the cap table is often cited as a signal of confidence in the custody and market-infrastructure business model, though it should not be read as investment advice, Orbis remains an unlisted company, and any exposure carries the liquidity and information risks typical of unlisted shares.
Orbis Financial FY26 Vs FY 25 at a Glance
These are the key indicators of the financial results in FY 26:
Metric | FY 25 | FY26 | YoY Change |
AUC (Rs. Cr) | 1,42,569 | 1,68,492 | +18.2% |
Consolidated revenue (Rs. Cr) | 556.16 | 487.92 | −12.27% |
PAT (Rs. Cr) | ~204.6 | ~209.7-209.9 | +2.47-2.59% |
EBITDA margin (consolidated) | 67.47% | 76.04% | +857 bps |
EBITDA margin (standalone) | 68.20% | 77.68% | +948 bps |
ROE | ~22.75-23% | 20.96% | −180 to-204 bps |
ROCE | 41.04% | 33.51-33.52% | −753 bps |
Debt-to-equity | 0.00x | 0.00x | Unchanged |
Conclusion
Orbis Financial FY26 results tells a story of a business getting more efficient even as its revenue mix shifted. Strong AUC growth confirms the underlying custody and market-infrastructure franchise is still winning business, and sharp cost discipline pushed EBITDA margin and PAT higher despite a 12.27% revenue decline.
But the drop in ROE and ROCE is a real signal that capital is growing faster than returns on it, a metric worth tracking in FY27 to see whether Orbis can convert its expanding net worth and AUC base back into stronger capital efficiency.
FAQs
Why did Orbis Financial's revenue fall in FY26 despite AUC growth of 18.2%?
Revenue fell mainly because interest income on client floats compressed in a softer rate environment and custody fee income dropped, partly due to a restructured commission arrangement, not because AUC or client relationships shrank.
Is Orbis Financial’s earnings growth sustainable in FY26?
FY26 Profit Growth (PAT up 2.47 - 2.59 %) mainly driven by cost reduction outpacing revenue decline. The question is whether sustainability will rely on float income stabilizing and recovery of custody fee revenue in the coming quarters.
Why did PAT increase and ROE and ROCE decrease?
ROE and ROCE decreased as net worth and capital employed increased faster (more than 20%) than profit (around 2.5%), diluting the returns generated per unit of capital.
Is Ashish Kacholia's investment in Orbis Financial a buy signal?
Kacholia’s continued stake is a vote of confidence in the custody business model but is not investment advice. Orbis is unlisted, and has the usual liquidity and information-availability risks of pre-IPO shares.


1.jpg)