
Stockify Logo
About
Unlisted Share Price
Buy
Call
Add as a preferred source on Google
Stockify Logo

26, 1st Floor, 16th Cross Road, 18th Main Rd, J P Nagar Phase 5, J. P. Nagar, Bengaluru, Karnataka 560078

+91 80414 37692contact@stockifyfintech.com

QUICK LINKS

  • NSE
  • BSE
  • MSEI
  • NCDEX
  • NSDL Login
  • CDSL Login
  • MCX
  • Smart ODR

RESOURCES

  • About Us
  • All Unlisted Shares
  • Corporate Profile
  • News
  • Blog
  • Annual Reports
  • FAQ
  • Connect
  • Become A Partner
  • Become A Contributor
  • DRHP Filed
  • Off-Market Annexures
  • Reviews
  • Investor Relations

UPCOMING IPO

  • Draft Offer Filed With SEBI
  • Red Herring Filed With ROC
  • Final Offer Filed With ROC
  • Other

Investment
Calculators

Powerful tools to plan your investments and financial future.

Investment Planning

  • SIP Calculator
  • Lumpsum Calculator
  • SWP Calculator
  • Goal SIP Calculator
  • Retirement Calculator

Loans & EMI

  • Home Loan EMI Calculator
  • Car Loan EMI Calculator
  • Personal Loan EMI Calculator
  • Education Loan EMI Calculator
  • Business Loan EMI Calculator

Financial Planning

  • PPF Calculator
  • EPF Calculator
  • NPS Calculator
  • Mutual Fund Calculator
  • FD Calculator

Tax & Savings

  • Income Tax Calculator
  • GST Calculator
  • TDS Calculator
  • XIRR Calculator
  • EPF Withdrawal Calculator

Other Calculators

  • Inflation Calculator
  • Step Up SIP Calculator
  • Compound Interest Calculator
  • CAGR Calculator
  • Stock Average Calculator

© 2026 Stockify · stockify.net.in · All rights reserved

PrivacyTermsDisclaimer

Disclaimer: Investment in unlisted shares carries a high level of risk. The logic for investment in unlisted shares is different from listed shares. Please consult your financial advisor before investing. Stockify is a platform to facilitate buying and selling of unlisted shares. Past performance does not guarantee future returns. Stockify is not a SEBI-registered stockbroker.

JOIN
NSE Q1FY26 Financial Results Analysis | Stockify
NSE Q1FY26 Financial Results Analysis
Financial Services

NSE Q1FY26 Financial Results Analysis

The NSE Financial Results for Q1FY26 are out, giving mixed figures to investors with revenue down and profit up. Read the full analysis.

Piyush Jhunjhunwala
Piyush Jhunjhunwala
3 min read
Oct 3, 2025
Home›Blog›NSE Q1FY26 Financial Results Analysis

IPO bound National Stock Exchange (NSE) released its FY26 Q1 Financial Statements, reporting a 14% YoY rise in Profit After Tax. However, at the same time, we observed a dip in total income year-over-year for Q1.

Let's analyse the financial aspects of the latest NSE Q1FY26 results.

Particulars
(In Rs Crores)

Q1 FY 26

Q1 FY 25

Growth YoY%

FY 25

Total Income 

4,798

4,950

(3%)

19,177

Revenue from operations

4,032

4,910

(11%)

17,141

Total Expenses (Including contribution to Core SGF)

1,053

1,530

(31%)

5,040

Operating EBITDA

3,130

3,106

1%

12,647

EBITDA Margin

78%

69%

-

74%

PAT

2,924

2,567

14%

12,188

EPS

11.81*

10.37*

-

49.24

*Not Annualised.

  • Revenue from operations declined 11% YoY from Rs 4,510 crore in Q1FY25 to Rs 4032 crore in Q1FY26. A major factor contributing to this reduction can be the negative market sentiment, primarily driven by US trade tariffs under President Trump.

  • Total income of the stock exchange remained almost stable (with a 3% decline YoY), as NSE's other income from investments jumped by 41% from Rs 436 crore in Q1FY25 to Rs 616 crore in Q1FY26.

  • The operating EBITDA didn't change, but the EBITDA margin saw an improvement from 69% in Q1FY25 to 78% in Q1FY26.

  • PAT grew by 14% YoY from Rs 2,567 in Q1FY25 to Rs 2924 crores in Q1FY26.

  • The Quarterly EPS grew by almost 14% YoY from Rs 10.37 per share in Q1FY25 to Rs 11.81 in Q1FY26.

Check here for the full presentation document by NSE (Click Here).

F&O Transactions Decline

The F&O transactions charges, which are one of the main sources of NSE's operational revenue, saw a decline by 14% YoY as NSE collected only Rs 3,150 crores in Q1FY26 as compared to Rs 3,653 crores in Q1FY25. Despite this, average daily turnover in the F&O segment rose 39% YoY to ₹360 lakh crore. (Source: Mint).

NSE Unlisted Share Price Declines 6% One Month
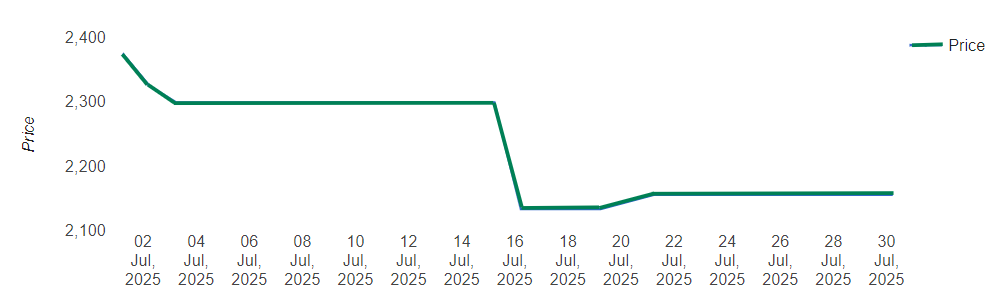
The NSE Share price has declined by 6% in the unlisted market, from Rs 2,375 per share to Rs 2,243 per share. However stock has risen by 14% in the last 6 months. So the overall trend is upwards.

How can these results impact investor sentiments?

With the IPO around the corner, these results will be viewed positively by investors. The scale on which NSE is operating, as well as its duopoly status, has always been a positive factor for the rise of NSE Pre-IPO Shares. However, we will always advise investors to do thorough research before making any investment decision.


Related Articles

SBI Mutual Fund IPO Roadshow  Begins: Know IPO Details
May 29, 2026

SBI Mutual Fund IPO Roadshow Begins: Know IPO Details

Piyush Jhunjhunwala
Piyush Jhunjhunwala
Read →
Wipro Shares Jump Nearly 5%; What Shareholders Need to Know Today
May 29, 2026

Wipro Shares Jump Nearly 5%; What Shareholders Need to Know Today

Shweta Sharma
Shweta Sharma
Read →
HDFC Bank Shares Fall 2.5% After Report on Internal Probe into ₹45 Crore Interest Payments
May 28, 2026

HDFC Bank Shares Fall 2.5% After Report on Internal Probe into ₹45 Crore Interest Payments

Shweta Sharma
Shweta Sharma
Read →
Piyush Jhunjhunwala

Piyush Jhunjhunwala

CA | CPA | Founder Stockify

⚠️

Disclaimer: Investment in unlisted shares carries a high level of risk. The logic for investment in unlisted shares is different from listed shares. Please consult your financial advisor before investing. Stockify is a platform to facilitate buying and selling of unlisted shares.

Share:
Analyze with AI:
ChatGPT
Perplexity
Claude
Gemini
Grok

Table of Contents

01F&O Transactions Decline02NSE Unlisted Share Price Declines 6% One Month03How can these results impact investor sentiments?

Invest in Unlisted Shares

Get exclusive access to pre-IPO stocks. Fill the form to get our latest price list.