
• Stockify Home
  • About Stockify
  • Pre-IPO and Unlisted Shares
  • Buy Unlisted Shares
  • Unlisted Shares Price List
  • Stockify Blog
  • Stockify News
  • Stockify Media
  • Stockify Events
  • Annual Reports
  • DRHP Filed Companies
  • Off Market Annexure
  • Investor Relations
  • Stockify Reviews
  • Contact Stockify
  • Privacy Policy
  • Terms and Conditions
  • Disclosures
  • SIP Calculator
  • Lumpsum Calculator
  • SWP Calculator
  • Income Tax Calculator
  • NSE India Unlisted Shares
  • Hero Fincorp Unlisted Shares
  • NSE India Unlisted Shares
  • Metropolitan Stock Exchange (MSEI) Unlisted Shares
  • Chennai Super Kings Unlisted Shares
  • NCDEX (National Commodity & Derivatives Exchange) Limited Unlisted Shares
  • Oravel Stays Ltd (OYO Rooms) Unlisted Shares
  • Capgemini Technology Services India Limited Unlisted Shares
  • AITMC Ventures Pvt Unlisted Shares
  • Apollo Green Energy Unlisted Shares
  • Arohan Financial Services Unlisted Shares
  • Ask Investment Managers Unlisted Shares
  • Axles India Unlisted Shares
  • BigBasket Unlisted Shares
  • BLSX Limited Unlisted Shares
  • Bira91 (B9 Beverages Pvt Ltd) Unlisted Shares
  • Boat Unlisted Shares
  • Bootes Impex Tech Unlisted Shares
  • Cochin International Airport Limited Unlisted Shares
  • Delta Galaxy Unlisted Shares
  • ESDS Software Solutions Unlisted Shares
  • Empire Spices and Foods Ltd Unlisted Shares
  • Fino Paytech Limited Unlisted Shares
  • Frick India Pvt Ltd Unlisted Shares
  • Greenzo Energy India Limited Unlisted Shares
  • HDFC Securities Limited Unlisted Shares
  • Hero Fincorp Limited Unlisted Shares
  • Hindustan Power Exchange Limited Unlisted Shares
  • Incred Holdings Unlisted Shares
  • Indian Potash Limited Unlisted Share
  • Indofil Industries Limited Unlisted Shares
  • Inox Leasing & Finance Limited Unlisted Shares
  • Kannur International Airport Limited Unlisted Shares
  • LAVA International Limited Unlisted Shares
  • Maharashtra Knowledge Corporation Unlisted Shares
  • Matrix Gas And Renewables Limited
  • Maverick Simulation Solutions Limited Unlisted Shares
  • Merino Industries Limited Unlisted Shares
  • Mohan Meakin Limited Unlisted Shares
  • Motilal Oswal Home Finance Limited Unlisted Shares
  • NCL Buildtek Limited Unlisted Shares
  • National E-Repository Limited Unlisted Shares
  • Nayara Energy (Formerly Essar Oil) Limited Unlisted Shares
  • Onix Renewable Unlisted Shares
  • Orbis Financial Corporation Ltd Unlisted Shares
  • PL Capital Market Unlisted Shares
  • PNB Finance and Industries Ltd Unlisted Shares
  • Parag Parikh Financial Advisory Services Limited Unlisted Shares
  • Paymate India Ltd Unlisted Shares
  • Pharmeasy Unlisted Shares
  • Pharmed Limited Unlisted Shares
  • Philips India Ltd Unlisted Share
  • Polymatech Electronics Pvt Ltd Unlisted Shares
  • Power Exchange India Unlisted Shares
  • RRP S4E Innovation Unlisted Shares
  • Religare Health Insurance Unlisted Shares
  • Roots Multiclean Limited Unlisted Shares
  • SBI Fund Management Limited Unlisted Shares
  • SBI General Insurance Ltd Unlisted Shares
  • Spray Engineering Devices Unlisted Shares
  • Sterlite Electric Limited Unlisted Shares
  • Veeda Clinical Research Unlisted Shares
  • Vivriti Capital Unlisted Shares
  • Sterlite Grid 5 Limited Unlisted Shares
Stockify Logo
About
Unlisted Share Price
Buy
Call
Add as a preferred source on Google
⚠️

Disclaimer: The information provided by Stockify is for educational and informational purposes only and does not constitute investment advice. Stockify is not a SEBI-registered broker, investment advisor, or research analyst. Investments in unlisted shares involve risks. Please consult your financial advisor and conduct your own due diligence before making any investment decision.

Stockify Logo

26, 1st Floor, 16th Cross Road, 18th Main Rd, J P Nagar Phase 5, J. P. Nagar, Bengaluru, Karnataka 560078

+91 8042453560contact@stockifyfintech.com

QUICK LINKS

  • NSE
  • BSE
  • MSEI
  • NCDEX
  • NSDL Login
  • CDSL Login
  • MCX
  • Smart ODR

RESOURCES

  • About Us
  • All Unlisted Shares
  • Corporate Profile
  • News
  • Blog
  • Annual Reports
  • FAQ
  • Screener

Company

  • Connect
  • Become A Partner
  • Become A Contributor
  • DRHP Filed
  • Off-Market Annexures
  • Reviews
  • Investor Relations

UPCOMING IPO

  • Draft Offer Filed With SEBI
  • Red Herring Filed With ROC
  • Final Offer Filed With ROC
  • Other

© 2026 Stockify · stockify.net.in · All rights reserved

PrivacyTermsDisclaimer
JOIN
CSK FY26 Financials: Revenue Rises 3.5%, Profit Falls 23% | Stockify
Sports

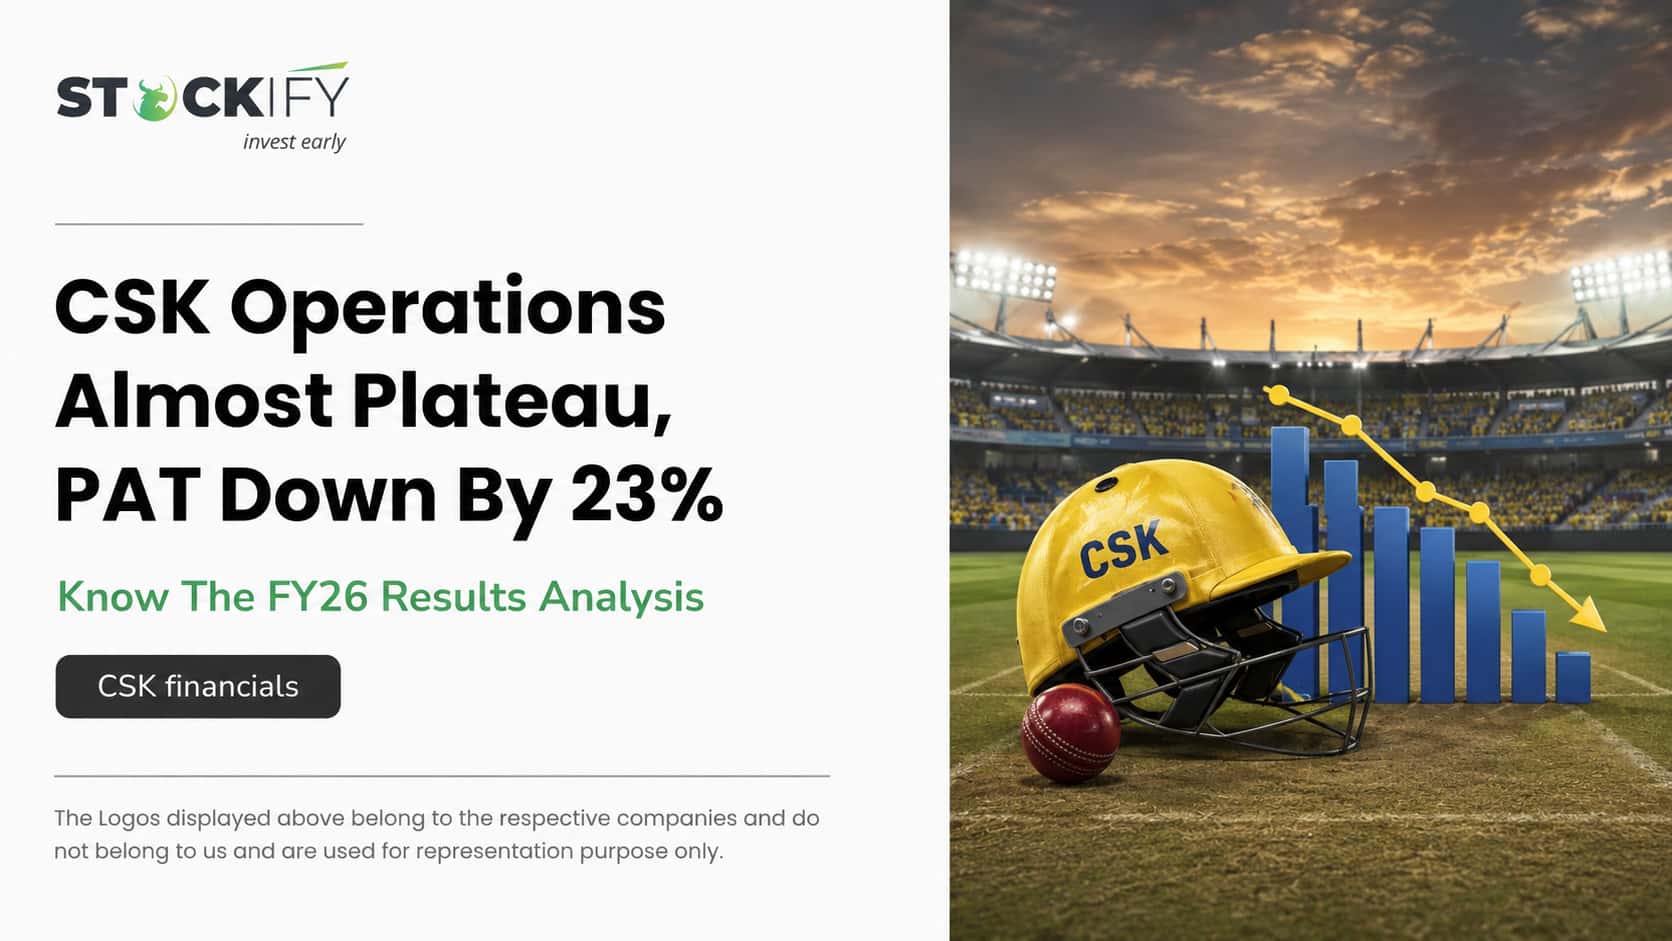
CSK FY26 Financials: Revenue Rises 3.5%, Profit Falls 23%

CSK FY26 financials show revenue growth despite lower central rights income, while PAT fell 23%. Explore CSK's revenue, expenses, margins, and dividend.

Rahul Khatuwala
Rahul Khatuwala

CA | Ex Wipro | Co-Founder Stockify

6 min read
Sep 2, 2026
CSK Financial Results
Home›Blog›CSK FY26 Financials: Revenue Rises 3.5%, Profit Falls 23%

Chennai Super Kings is one of the most popular names in Indian cricket, and its business has expanded beyond just the IPL team. Chennai Super Kings Cricket Ltd (CSKCL) saw an increase in revenue for FY26, but its latest figures also show some changes to look at.

So, how did the company perform over the year, and what do the financials tell us about the business?

CSKCL FY26 Financials Analysis

Particulars

FY25

FY26

YoY Change

Revenue from Operations

Rs. 674 Cr

Rs. 697 Cr

3.5%

Total Revenue

Rs. 704 Cr

Rs. 712 Cr

1.1%

Total Expenses

Rs. 495 Cr

Rs. 542 Cr

9.6%

PBT

Rs. 210 Cr

Rs. 170 Cr

-19.1%

PAT

Rs. 148 Cr

Rs. 114 Cr

-23.3%

PAT attributable to owners

Rs. 151 Cr

Rs. 124 Cr

-18.3%

EPS

Rs. 4.08

Rs. 3.47

-15.0%

Source: CSK FY26 Annual Report

Revenue Grew Despite Lower Central Rights Income

This is probably the most interesting part of CSKCL's FY26 numbers. Central Rights continued to be the company's largest revenue source, but income from it declined to Rs. 458 Cr in FY26 from Rs. 493 Cr in FY25, a fall of around 7%. But CSKCL managed to offset this decline through other sources.

Sponsorship income increased to Rs. 154 Cr from Rs. 116 Cr, while other tournament-related income rose to Rs. 67 Cr from Rs. 54 Cr. Academy membership, academy facilities, management and advisory services and other smaller revenue streams also contributed to growth.

What increased the operating costs?

  • Player and support staff remuneration: Rs. 196 Cr vs Rs. 160 Cr

  • Franchisee fee: Rs. 133 Cr vs Rs. 176 Cr

  • Tournament expenditure: Rs. 82 Cr vs Rs. 63 Cr

  • Administration expenses: Rs. 45 Cr vs Rs. 29 Cr

  • Academy coaches and support staff remuneration: Rs. 6 Cr vs Rs. 1 Cr

So, the increase in expenses is not simply a case of the company becoming inefficient. Hence, some of these costs are directly related to developing and running the cricket business. For example, spending more on players and tournaments is part of running the main cricket business. Similarly, the higher spending on the Academy is linked to CSKCL expanding its Academy network 

Employee Costs Also Increased Sharply

Employee benefit expenses increased around 51.5% from Rs.17 cr to Rs. 25 Cr in FY26. The increase included higher salaries and wages, employee benefits and remuneration-related costs. Again, higher employee spending likely isn't automatically negative. Employee and operating costs can increase as a company expands its activities. However, the impact of these higher costs on revenue and profitability remains important for investors to watch. 

EBITDA and Margins: The Key Concern

CSKCL does not separately report consolidated EBITDA in the Annual Report. So, for comparison, EBITDA can be derived by adding finance costs and depreciation back to PBT. On this basis:

Particulars

FY25

FY26

Derived EBITDA

Rs. 222 Cr

Rs. 182 Cr

EBITDA Margin

31.5%

25.5%

That means CSKCL's estimated/derived EBITDA declined by around 18%, while the EBITDA margin fell by roughly 6 percentage points. This could be important because it tells us that the issue wasn't just lower profit after tax. The pressure was already visible at the operating profitability level.

Why Did Profit Fall?

CSKCL's total expenses increased to Rs. 542 Cr from Rs. 495 Cr, an increase of 9.6%. Revenue, meanwhile, grew only 1.1% at the total-revenue level. The biggest expense is cost of operations, which increased to Rs. 488 Cr from Rs. 451 Cr, up 8.4%. A closer look shows where the additional spending went.

Other Income Also Fell

Another factor affecting the bottom line was other income. Other income fell sharply to Rs. 15 Cr in FY26 from Rs. 30 Cr in FY25. The Annual Report shows that interest income on bank deposits and loans, advances and deposits declined significantly. At the same time, CSKCL recorded higher gains from the sale of investments during FY26.

This is worth separating from the core business. Operating revenue actually increased, while the decline in other income was largely related to changes in investment income. So, investors shouldn't interpret the entire decline as a deterioration in CSKCL's core operating business.

The Cash and Debt Fell Sharply

Cash and cash equivalents fell sharply to Rs. 71 Cr in FY26 from Rs. 336 Cr in FY25. However, borrowings remained extremely low. Consolidated borrowings declined to just Rs. 0.16 Cr from Rs. 5.13 Cr. So, the fall in cash is something investors may want to keep an eye on. At the same time, CSKCL’s reported borrowings remained low, suggesting that debt was not a major part of its balance sheet. 

What Does This Mean for CSK Investors? 

CSKCL’s FY26 numbers give investors a mixed picture. The company proposed a Rs. 1 per share dividend, the same as last year, subject to shareholder approval. At the same time, the CSK unlisted share price has moved from around Rs. 187 to Rs. 250 over the past year, which is a rise of about 34%. For investors, the next thing to watch is whether the company can keep growing its business while maintaining its profits. The dividend and share price movements are useful points to consider, but CSKCL’s future financial performance will remain important.
Related Articles

CSK Financial Results
Sep 2, 2026

CSK FY26 Financials: Revenue Rises 3.5%, Profit Falls 23%

Rahul Khatuwala
Rahul Khatuwala
Read Article →
BoAt FY26 Financials Out: What Drove The 38% Profit Growth?
Sep 1, 2026

BoAt FY26 Financials Out: What Drove The 38% Profit Growth?

Piyush Jhunjhunwala
Piyush Jhunjhunwala
Read Article →
Oyo profits
Aug 31, 2026

Oyo Profits Growth 3X In FY26: Reach Near Rs 1,000 Crore

Piyush Jhunjhunwala
Piyush Jhunjhunwala
Read Article →
⚠️

Disclaimer: Investment in unlisted shares carries a high level of risk. The logic for investment in unlisted shares is different from listed shares. Please consult your financial advisor before investing. Stockify is a platform to facilitate buying and selling of unlisted shares.

Share:
Analyze with AI:
ChatGPT
Perplexity
Claude
Gemini
Grok

Table of Contents

01CSKCL FY26 Financials Analysis02What Does This Mean for CSK Investors?

Invest in Unlisted Shares

Get exclusive access to pre-IPO stocks. Fill the form to get our latest price list.