
.jpg.jpeg)
The most recent quarterly and nine-month financial results from the Metropolitan Stock Exchange of India (MSEI) have brought the market back into attention after months of low activity. A significant increase in total income and a significant decrease in quarterly losses indicate a change below the surface, even though operating revenue is still low.
The figures raise the crucial question: are these early indications of a larger operational turnaround or just a statistical improvement?
MSEI 9-Month Financial Performance Overview
UNAUDITED | UNAUDITED | UNAUDITED | UNAUDITED | UNAUDITED | |
Particulars (in Cr.) | Quarter Ended Dec 31, 2025 | Quarter Ended Sep 30, 2025 | Quarter Ended Dec 31, 2024 | Nine Months Ended Dec 31, 2025 | Nine Months Ended Dec 31, 2024 |
Revenue from Operations | 81 | 86 | 116 | 262 | 312 |
Total Income | 2,029 | 1,408 | 340 | 4,083 | 1,142 |
PAT (Loss) | -15 | -409 | -989 | -1,168 | -2,704 |
EPS (Basic) | 0 | 0 | -0.02 | -0.01 | -0.06 |
Revenue from Operations
Operational revenue for the December 2025 quarter was Rs. 81 lakh, which was lower than the Rs. 116 lakh recorded in the December 2024 quarter but generally stable when compared to Rs. 86 lakh in the September 2025 quarter.
On the basis of 9 months, operating revenue decreased to Rs. 262 lakh from Rs. 312 lakh in the same period last year, suggesting that core trading and transaction-related activity decreased during that time.
Total Income
Total income for the December 2025 quarter increased significantly to Rs. 2,029 lakh, despite low operating revenue, from Rs. 1,408 lakh in the previous quarter and Rs. 340 lakh in the December 2024 quarter. This indicates that non-operating income made a significant contribution during the quarter.
Total income increased significantly to Rs. 4,083 lakh for the nine months that ended in December 2025 from Rs. 1,142 lakh for the same period the previous year, emphasising the increasing contribution made by other income to total earnings.
Profit After Tax (PAT)
In comparison with a loss of Rs. 409 lakh in the September 2025 quarter and Rs. 989 lakh in the December 2024 quarter, MSEI reported a loss after tax of Rs. 15 lakh in the December 2025 quarter, which represents a significant improvement.
Net loss decreased to Rs.1,168 lakh at the nine-month level from Rs.2,704 lakh during the same period last year. Better cost control and increased operational efficiency over time are reflected in this decrease in losses.
Earnings Per Share (EPS)
In keeping with the lower cumulative losses recorded during the period, the EPS loss for the nine-month period decreased to Rs.0.01 from Rs.0.06 in the prior year.
Overall, the financials indicated the losses have decreased on a quarterly and nine-month basis due to increased total income and better cost control, even though core operating revenue is still low. Non-operating income and expense control continue to have an impact on performance during the period.
Yearly Financials Overview
Particulars (in Cr.) | FY25 | FY24 | YoY Growth (%) |
Revenue | 17.4 | 21 | -17.10% |
Total Expenses | 46.9 | 61.6 | -23.90% |
EBITDA | -29.5 | -40.6 | Improved |
Other Cost | 5.4 | 7 | -22.90% |
Profit Before Tax | -34.9 | -47.6 | Improved |
Tax Expense | 0.6 | 1.2 | -50.00% |
Profit After Tax | -34.2 | -48.8 | Improved |
EPS | -0.06 | -0.1 | 0.4 |
EBITDA Margin (%) | -169.50% | -193.30% | Improved |
Net Margin (%) | -196.00% | -231.90% | Improved |
As per the yearly financials, MSEI reported revenue of Rs.17.4 crore for FY25, a 17.1% decrease from the previous year.
Significant improvement was seen in operating performance by lowering overall expenses by 23.9% to Rs. 46.9 crore. While net loss decreased to Rs. 34.2 crore from Rs. 48.8 crore in FY24, EBITDA loss decreased to Rs. 29.5 crore from Rs. 40.6 crore the previous year.
Consequently, despite lowered revenue growth, EPS improved to -Rs. 0.06 from -Rs. 0.10, indicating improved cost efficiency.
What Has Changed Since Trading Restarted (Jan 27 to Feb 17)?
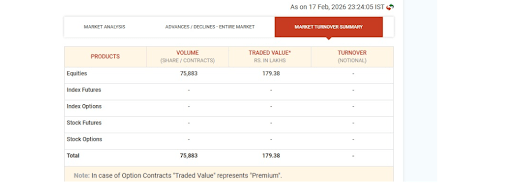
Source: MSEI Market Turnover Data
Market activity on the Metropolitan Stock Exchange of India (MSEI) has clearly changed in the weeks since live trading resumed on January 27.
On the first day of the restart, only 286 shares were traded, with a total traded value of about Rs.4 lakh. Derivative segments were not active.
By 17 February, participation in the equity market had significantly increased. The traded value increased to about Rs.179 lakh, and equity volumes increased to 75,883 shares. This indicated a sharp increase in equity volumes and value.
Overall, the shift from a system validation phase to the early phases of market re-engagement is reflected in the progression from a few initial trades to higher equity turnover.
MSEI Unlisted Share Price Overview
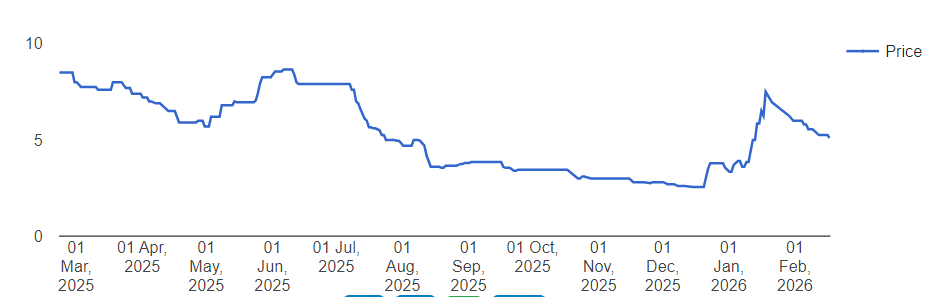
The sharp increase was seen in January in the share price of the Metropolitan Stock Exchange of India, which is currently trading at about Rs.5.04 and has entered a consolidation phase.
Before the price's correction from higher levels, it had risen from about Rs.3.5 in late December to roughly Rs.7.5 by mid-January.
Following a sharp increase, recent price movement suggests a re-correction, with trading currently taking place below recent peaks. Therefore, the current might represent a price adjustment following increased activity.
Also Read: Future Growth Rate of Metropolitan Stock Exchange (MSEI)