

Parag Parikh Financial Advisory Services (PPFAS) has released its Quarterly Statements for the period ending 31st March 2026. With revenue from operations increasing nearly 40% yearly, whereas AUM reaches Rs.1.47 lakhs cr. Let's break down PPFAS latest results in this blog.
PPFAS Latest Results Released
Particulars (Rs. Cr.) | Q3 FY26 (Dec 2025) | Q4 FY26 (Mar 2026) | FY26 | FY25 | Growth |
Revenue from Operations | 169.35 | 143.13 | 601.84 | 428.84 | 40.3% |
Total Income | 169.40 | 143.22 | 602.22 | 429.09 | 40.3% |
Total Expenses | 38.29 | 58.07 | 135.21 | 93.34 | 44.9% |
EBITDA | 133.34 | 85.15 | 467.00 | 335.76 | 39.1% |
EBITDA Margin (%) | 78.7% | 59.5% | 77.5% | 78.3% | -0.8% |
Profit After Tax (PAT) | 98.63 | 58.73 | 347.56 | 246.60 | 41.0% |
PAT Margin (%) | 58.2% | 41.0% | 57.8% | 57.5% | +0.3% |
EPS | 127.93 | 75.80 | 447.91 | 321.45 | 39.3% |
Source: PPFAS Quaterly results
A. Revenue Crosses Rs 600 Cr Mark
Firstly, Q4 FY26 appears weaker than Q3 FY26, with revenue declining 15.5% QoQ and PAT falling 40.5%. This could be due to a sharp increase in expenses, which is 51.7%.
One of the reasons for the higher cost base could be the recognition of an additional Rs 3.03 cr employee benefit liability following the implementation of revised employee benefit regulations, a one-time accounting impact disclosed by the company.
Despite the softer quarter, the full-year performance remained strong. Revenue crossed Rs. 600 crore for the first time.
PPFAS revenue increased from Rs 428.8 cr to Rs 601.8 cr in FY26, giving 40.3% growth. In this, the largest revenue contributor remains the fees and commission income.
While PAT grew 41% to Rs 347.6 cr, indicating that FY26 was driven by strong growth in the core asset management and advisory businesses.
B. Earnings Per Share (EPS)
Earnings per share also climbed yearly from Rs. 321.5 per share to Rs. 447.9 per share in FY26, with a growth of 39.3%.
Overall, the operations and profit jumped due to a possible increase in Assets Under Management (AUM), creating healthy financial growth for PPFAS.
PPFAS Revenue Breakdown Analysis
Revenue (in Rs. Cr.) | FY26 | FY25 | Contribution FY26 |
Fees & Commission Income | 573.75 | 375.88 | 95.3% |
Interest Income | 0.74 | 0.15 | 0.1% |
Net Gain on Fair Value Changes | 27.36 | 52.81 | 4.6% |
Total Revenue from Operations | 601.84 | 428.84 | 100% |
Out of the total Rs 601.8 cr revenue, approximately 95% came from fees and commission income. It is showing that PPFAS' growth is primarily driven by its core asset management and advisory business.
PPFAS AUM Financials: Growth Driving Revenue Expansion
Particulars (Rs Lakh Cr) | Mar-25 | Dec-25 | Mar-26 | YoY Growth |
PPFAS AUM | 1.06 | 1.51 | 1.47 | 38.7% |
Quarterly Average AUM (QAAUM) | 1.02 | 1.46 | 1.52 | 49.8% |
Equity QAAUM | 0.94 | 1.34 | 1.39 | 48.3% |
Closing AUM | 1.06 | 1.51 | 1.46 | 37.7% |
QAAUM Market Share | 1.50% | 1.80% | 1.86% | +36 bps |
Closing AUM Market Share | 1.61% | 1.88% | 1.98% | +37 bps |
Source: PPFAS Financials
AUM is a major growth indicator for an asset management company. It could increase the company's earnings, as higher management fees translate to revenue growth.
AUM continued to be one of the biggest growth drivers for PPFAS during FY26. The PPFAS AUM financials reached Rs 1.47 lakh cr as of March 2026, while Quarterly Average AUM (QAAUM) increased nearly 50% YoY to Rs 1.52 lakh cr.
Equity-orientated QAAUM also grew 48.3% YoY, reflecting strong investor preference for the company's equity-focused offerings.
The growth in QAAUM is particularly important because it directly impacts management fee income. Meanwhile, Closing AUM crossing Rs 1.46 lakh cr reflects the expanding scale of assets managed by PPFAS.
Overall, combined with the increase in market share, these trends could indicate that the company continued to grow faster than the broader mutual fund industry during FY26.
Rising Investor Base & SIP Book
Metric | FY25 | FY26 | Growth |
|---|---|---|---|
Unique Investors | 43.3 Lakh | 59.3 Lakh | 36.9% |
Active SIP Accounts | 28.2 Lakh | 37.7 Lakh | 33.7% |
SIP Book Size | Rs 1,061 Cr | Rs 1,591 Cr | 50.0% |
AUM growth could become more sustainable when it is supported by a growing investor base.
PPFAS added a significant number of investors during FY26, taking its total unique investors to nearly 59.3 lakh.
The growth of 33.7% in FY26 in active SIP accounts is particularly encouraging because SIPs provide recurring inflows and improve earnings visibility.
The SIP Book Size had a growth of around 50% in FY26. A larger SIP book might also reduce dependence on short-term market movements and support long-term AUM growth.
How Has Parag Parikh Unlisted Share Performed?
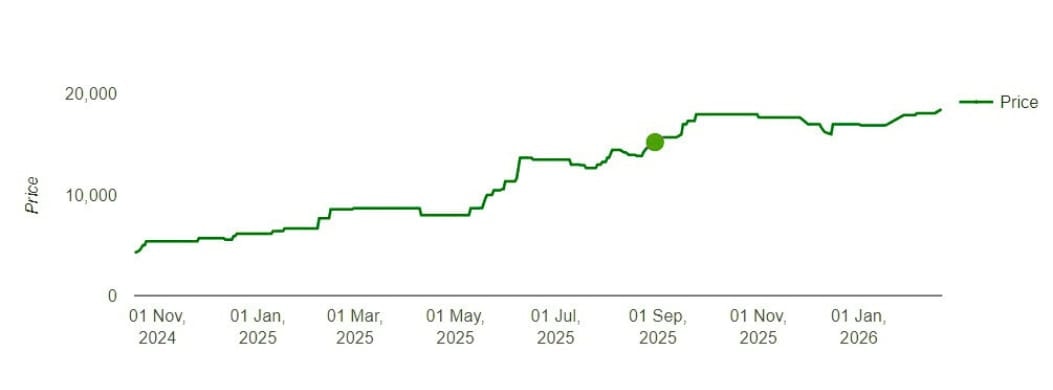
The Parag Parikh unlisted share price has increased sharply from Rs. 8555 to Rs. 18,500 per share. The increasing growth showed an appreciation of 115-120% in a single year.
The current price is roughly Rs. 18,460.
In terms of valuation, P/E is about 56-58x, which is higher than industry standards, where P/E is roughly 35x. This premium valuation might show investors' confidence.
With a market capitalisation of roughly Rs. 14000-Rs. 14500 cr, the company is positioned in the mid-cap segment of the financial services sector. Hence, reflecting its growing scale within the industry.
Is the PPFAS IPO near?
According to Money Control, Parag Parikh Financial Advisory Services is considering a potential stock market listing around 2030, with the timing largely aligned to the vesting of its final tranche of employee stock options, according to CEO Neil Parikh.
He said listing the company before ESOPs fully vest could lead to a significantly higher tax burden for employees, especially if the shares list at a premium, as employees are currently taxed based on the book value of shares while the company remains unlisted. Parikh added that the proposed timeline is indicative and flexible, stressing that the firm is in no rush to go public and will consider an IPO only when it makes strategic and operational sense.