
NSE and BSE have dominated the market for a long time, but there is likely to be one more competitor added, that is, MSEI. MSEI, for a long time, stayed out of share trading, but from Jan 27, the exchange finally resumed trading. Is MSEI finally finding its footing? Let’s break down how MSEI works, what’s driving this growth, and whether it actually has the potential to stand out in India’s competitive market.
What is MSEI & How Does Its Business Model Work?
MSEI is a SEBI-regulated stock exchange that provides a platform where people can trade in different financial instruments like equities, derivatives, and currencies. While it may not be as big as NSE or BSE, MSEI might be trying to build its own space in the market by offering a technology-focused and cost-efficient trading platform. It started with currency derivatives and gradually expanded into other segments, aiming to attract both retail and institutional participants.
Talking about its business model, MSEI primarily earns by facilitating trades on its platform and offering various financial products like ETFs, bonds, and SME listings. The exchange focuses heavily on technology to ensure smooth, fast, and secure transactions. Along with trading, it also does market awareness and improves financial participation. Overall, MSEI’s model revolves around increasing trading activity, expanding product offerings, and building a reliable ecosystem to compete in India’s highly competitive exchange space.
MSEI Volume Growth Analysis
Period | Shares Traded | Trade Value (Rs. Lakhs) |
27 Jan 2026 | 65,000 | 101 lakh |
Mid-Feb 2026 | Rising | Increasing |
Mid March 2026 | 1L+ | 100–160 Lakhs |
30 March 2026 | 38,914 | 385.7 Lakhs |
MSEI’s trading activity between 27 January and 31 March 2026 shows a clear improvement in liquidity when we look at trade value in lakhs. The exchange started with very low activity, with trade value around Rs. 101 lakh, indicating limited participation after trading resumed. However, as weeks passed, volumes and value gradually picked up, especially during February, supported by liquidity initiatives like LES.
By March, the exchange started seeing stronger traction, with multiple days crossing Rs. 100-160 lakhs in trade value. The biggest spike came on 30 March, when trade value touched around Rs. 385.7 lakhs, showing a sharp rise in participation.
LES Scheme Used By MSEI for Volume Growth
MSEI introduced the Liquidity Enhancement Scheme (LES) as one of its challenges was low trading activity. In simple terms, the exchange is likely encouraging market makers to actively place buy and sell orders so that investors can easily trade without facing liquidity issues. To make this work, MSEI offers financial incentives, sometimes up to Rs. 40 lakh per month, along with possible fee waivers, making it attractive for participants to stay active in the market. Since its relaunch in January 2026, this move has possibly started showing results, with a noticeable rise in trading volumes and transactions. Overall, LES acts as a catalyst to revive market participation, improve price discovery, and bring life back to the inactive stocks on the exchange.
Also Read: MSEI Liquidity Enhancement Scheme (LES), Process And Impact
What Are The Financial Results Of MSEI?
Particulars (in Rs cr.) | FY25 | FY24 |
|---|---|---|
Revenue | 17.4 | 21 |
Expenses | 46.9 | 61.6 |
EBITDA | -29.5 | -40.6 |
Profit Before Tax | -34.9 | -47.6 |
Profit After Tax (PAT) | -34.2 | -48.8 |
Net Income | -34.1 | -48.7 |
EPS | -0.06 | -0.1 |
EBITDA Margin (%) | -169.50% | -193.30% |
Net Margin (%) | -196% | -231.90% |
A. Revenue
The company had a 17.1% decline in revenue year-over-year. It fell to Rs.17.4 Cr in FY25 from Rs.21.0 Cr in FY24. This can suggest there are demand-side challenges or execution inefficiencies.
B. Expense
The company significantly reduced its expenses by nearly 24%, which is a positive sign of cost control. This indicates management’s focus on improving operational efficiency.
C. EBITDA
Although EBITDA remains negative at -29.5 in FY25, the company has reduced its operating losses by over 27%. This improvement likely shows better cost management, but the core business is yet to reach profitability.
D. EBITDA Margins
Margins have improved compared to last year to -169.50% in FY25, reflecting better cost efficiency. However, both EBITDA and net margins remain highly negative, highlighting that the business model is still under stress.
E. PAT
The net loss has reduced significantly by nearly 30%. It decreased from 48.8 to 34.2 in FY25. This indicates progress toward a potential turnaround. However, the company is still far from achieving profitability.
F. EPS
The improvement in EPS indicates that losses per share have decreased, which might be a positive signal for investors. EPS improved from -0.10 to -0.06, showing a +40% improvement. However, since EPS is still negative, shareholder value continues to be under pressure.
Balance Sheet Overview
The balance sheet shows great improvement, with a sharp rise in assets to Rs 443.9 cr, and equity is 2x to Rs 396.7 cr, likely driven by fresh funding. At the same time, liabilities have reduced to Rs 47.2 cr, and cash reserves have increased, indicating better financial stability.
Cash Flow Analysis
Despite the continued negative operating cash flow of - Rs. 68.4 cr, the company has improved its overall cash position due to strong financing inflows (Rs. 33 cr). This likely indicates dependence on external funding to sustain operations and growth.
Also Read: MSEI Losses Reduce Despite Weak Core Revenue. What's Happening?
MSEI Unlisted Share Price Gave 3.5x return in 3 Years
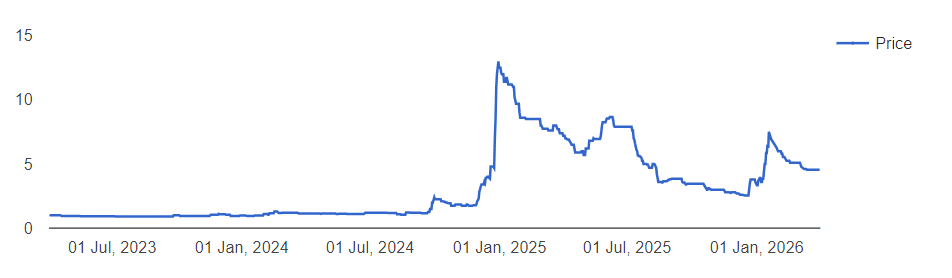
MSEI’s unlisted share price has sharply risen over a period of 3 years from Rs.1 in FY23 to Rs.6.95 in FY26 in the Jan month, showing 352% growth. The current MSEI unlisted share price is around Rs. 4.52. The price peaked in the month of Jan, likely due to the resumption of trading on the MSEI platform, although prices are at a correction currently. Also, the various other external factors apart from financials are also affecting the MSEI unlisted share price, such as geopolitical tensions going on.
Who Are The Promoters Holding?
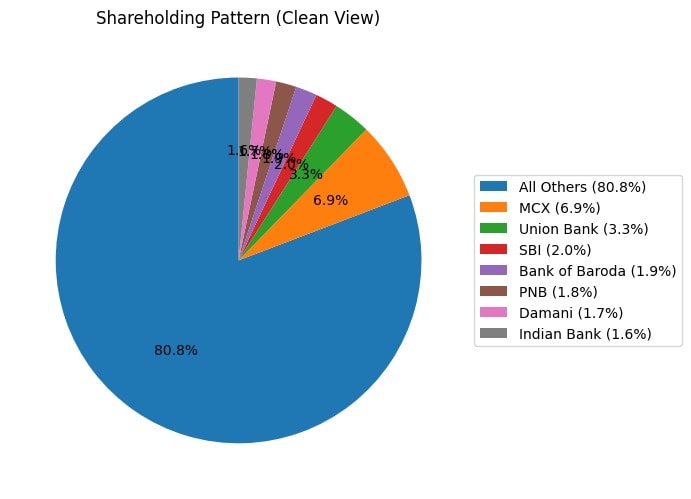
The largest stake is held by the Multi-Commodity Exchange of India Ltd. at 6.9%, followed by several PSU banks like Bank of Baroda, Union Bank, etc. Ace investor Radhakrishnan Damani holds a small stake of 1.7%.
MSEI IPO UPDATE
No official confirmation update for the MSEI IPO. Although trading was relaunched on 27th Jan with the LES scheme. Previously, between 2024 and '25, MSEI raised Rs.1240 cr funding in various rounds, in which, apart from private placement, Billionbrains Garage Ventures, Groww's parent, and Zerodha's Rainmatter Investments had also invested. Currently, you can hold a stake in MSEI by buying MSEI Unlisted Shares.
Disclaimer:
The content is intended for informational and educational purposes only and does not constitute any offer, solicitation, or recommendation to buy or sell securities. We do not claim access to confidential or unpublished price-sensitive information. Readers are advised to refer to official filings such as the Draft Red Herring Prospectus (DRHP) and consult their financial advisors before making any investment decisions.
.jpg.jpeg)