


TL;DR
NSE continues to remain India's largest stock exchange with rising trading volumes and different products. The strong profitability is reflected in their PAT and revenue growth in FY25. Not just that, strong margins kept the business growing. With much awaited IPO closer to reality, NSE offers investor a strong long term fundamentals. We just need to see how good the valuation turns out at this point.
----------------------------
As India’s economy becomes more organised, digitised, and transparent, exchanges like the National Stock Exchange of India are emerging as foundational pillars of the financial system.
Once primarily seen as a platform for equity trading, NSE has been ranked the world’s 7th strongest exchange brand out of the top 10 most valuable global stock exchanges and now sits at the centre of India’s capital market infrastructure.
Backed by dominant positions in equity and index derivatives, high liquidity and consistent profitability, NSE has steadily expanded into clearing and settlement, index and data services, ETFs, international trading through GIFT City and multiple debt and currency products.
Further, we give a financial analysis of NSE's share price analysis, operational growth and why it is important in the long run, in simple and practical terms.
Investor Base & Investment Growth
National Stock Exchange of India today has one of the widest investor bases among unlisted Indian companies, with over 1.77 lakh shareholders even before its IPO. This makes NSE the most widely owned unlisted company in India, reflecting deep and long-term investor participation.
NSE shareholding pattern, includes some of the largest and most trusted institutional investors, such as Life Insurance Corporation of India (LIC), State Bank of India (SBI) and others.
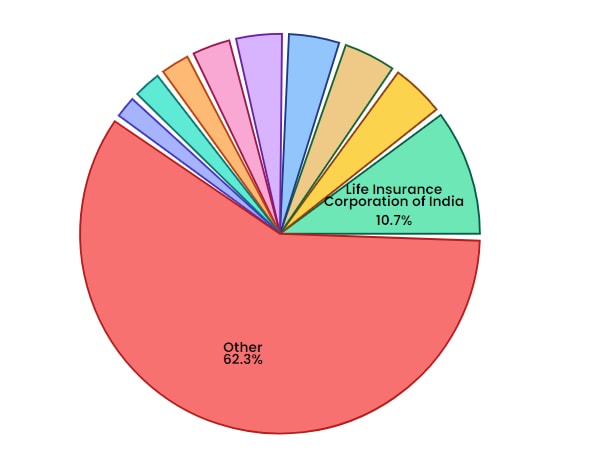
Investor interest has continued to grow despite NSE remaining unlisted for nearly a decade. In the pre IPO market, demand has strengthened sharply after regulatory clarity and SEBI approval, pushing NSE’s unlisted share price above Rs.2,000 and valuing the exchange at over Rs. 5 lakh crore.
This broad and growing investor base shows that NSE is acting as core financial infrastructure, with investors willing to stay invested through long regulatory delays in anticipation of long-term value creation.
NSE Business And Operational Growth
NSE’s business strength is best understood by looking at how trading activity has scaled year after year, as shown in the table below. The data clearly shows that NSE’s earnings growth is not limited to headline numbers. It is also visible in actual traded volumes.
Year | No of companies listed* | No. of securities traded # | No. of trades(in Lakhs) | Traded Quantity(in Lakhs) | Turnover(₹ Cr) | Average Daily Turnover(₹ Cr) | Demat Securities Traded(in Lakhs) | Demat Turnover | Market Capitalisation(₹ Cr) |
2025-2026 | - | - | - | - | - | - | - | - | - |
2024-2025 | 2,720 | 6,381 | 96,838 | 1,04,27,995 | 2,81,27,848 | 1,12,963 | 1,04,27,995 | 2,81,27,848 | 4,10,86,929 |
2023-2024 | 2,439 | 5,065 | 68,125 | 1,01,79,861 | 2,01,03,439 | 81,721 | 1,01,79,861 | 2,01,03,439 | 3,84,21,668 |
2022-2023 | 2,191 | 3,983 | 47,331 | 62,76,848 | 1,33,05,073 | 53,434 | 62,76,848 | 1,33,05,073 | 2,56,32,704 |
2021-2022 | 2,065 | 3,602 | 55,709 | 76,10,238 | 1,65,66,237 | 66,799 | 76,10,238 | 1,65,66,237 | 2,61,81,064 |
2020-2021 | 1,969 | 3,297 | 46,328 | 74,29,579 | 1,53,97,908 | 61,839 | 74,29,579 | 1,53,97,908 | 2,02,95,813 |
Source: NSE Capital Market Data
1)Trading Activity
Between FY21 and FY25, NSE has seen a steady and meaningful expansion across all key operating metrics:
Companies available for trading increased from 1,910 to 2,645 in FY25, reflecting deeper market breadth and more listings.
The number of securities traded nearly doubled from 3,297 to 6,381 during the same period.
The number of trades rose sharply from 46,328 lakh to 96,838 lakh in FY25, showing an increase in investor participation.
2) Turnover and Liquidity
Total turnover increased from Rs.1.54 lakh crore in FY21 to Rs.2.81 lakh crore in FY25.
Average daily turnover climbed from around Rs.61,839 crore in FY21 to nearly Rs.1.13 lakh crore in FY25.
Despite the sharp rise in volumes, average trade size has remained stable, indicating broad based participation rather than concentration among a few large players.
This sustained rise in daily turnover shows why NSE remains the primary liquidity hub for Indian capital markets.
3) Market Capitalisation
The expansion in trading activity helps to grow the market capitalisation from about Rs. 2.03 lakh crore in FY21 to over Rs. 4.10 lakh crore in FY25, effectively doubling in 4 years.T his shows more listing of companies then higher valuation will be there.
4) Product Mix
NSE’s scale is supported by a diversified product offering, which spreads activity across asset classes:
Equity cash market: equities, ETFs, mutual fund units, and SME listings via the EMERGE platform
Derivatives: equity and index futures & options, which contribute the largest share of volumes
Currency, interest rate, and commodity derivatives
Fixed income products: government securities, corporate bonds, and sovereign gold bonds
Among these, equity and index derivatives remain the biggest drivers of trading volumes, giving NSE a structural advantage due to higher liquidity.
5) NSE Revenue
Transaction income is NSE’s largest revenue source, contributing about 79% of total revenue in recent years. It is driven by the number of trades, traded volumes, and overall turnover, all of which have grown steadily over time.
This has allowed NSE to scale revenues without a matching rise in costs, supporting high margins. A stable fee structure and rising volumes also ensure predictable and recurring earnings.
6) Beyond Domestic Markets
Beyond domestic markets, GIFT City is emerging as a key growth driver, with derivatives open interest running in trillions, giving NSE access to international trading under the IFSC framework.
Overall, higher listings lead to more trades and volumes, helping NSE generate consistent earnings and retain its dominant position in India’s capital markets.
NSE Financial Analysis Overview
Particulars (In Cr. Rs) | FY23 | FY24 | FY25 |
Revenue | 12,765.40 | 16,433.60 | 19,176.80 |
Expenses | 2,224.80 | 3,169.40 | 4,259.70 |
EBITDA | 10,540.60 | 13,264.30 | 14,917.10 |
EBITDA Margin | 82.60% | 80.70% | 77.80% |
Profit Before Tax | 10,041.60 | 11,184.30 | 15,474.80 |
Profit After Tax (PAT) | 7,501.90 | 8,406.50 | 11,605.80 |
EPS | 29.72 | 33.58 | 49.24 |
Revenue Growth (%) | 34.40% | 28.70% | 16.70% |
EPS Growth (%) | 40.30% | 13.00% | 46.60% |
A) Revenue Trend Over 3 Years
The NSE revenue has delivered steady growth over the last three years, with income rising from Rs.12,765.4 crore to Rs.19,176.8 crore in FY25. This growth has been due to higher trading volumes in equities and derivatives, supported by rising market participation.
B) EBITDA Performance
NSE’s EBITDA has remained robust and expanding, increasing from Rs.10,540.6 crore in FY23 to Rs.14,917.1 crore in FY25. This reflects NSE’s high operating leverage, where incremental revenues translate efficiently into operating profits due to a largely fixed cost technology-driven business model.
C) Operating Margin (EBITDA Margin)
Operating margins continue to remain exceptionally strong, though they have marginally moderated from 82.6% in FY23 to 77.8% in FY25.
The slight compression reflects investments in technology, compliance and infrastructure, but margins remain among the highest for global exchange businesses.
D) Profit After Tax (PAT)
NSE’s PAT has grown steadily from Rs.7,501.9 crore in FY23 to Rs.11,605.8 crore in FY25.
Importantly, this profit growth is operationally driven, backed by strong EBITDA and not dependent on one-off or exceptional income, indicating earnings sustainability.
E) Earnings Per Share (EPS)
EPS increased sharply from Rs.29.72 in FY23 to Rs.49.24 in FY25, representing a ~66% growth over two years.
The rise in EPS is supported by real operating profits and stable share count, making it a reliable indicator of shareholder value creation.
As compared to other exchanges, NSE already operates at peak efficiency in terms of volume. Future upside will depend on capital market depth, derivatives innovation and regulatory clarity.
NSE IPO UPDATE
According to the recent NSE IPO news, a major step towards its long-awaited public listing was taken after receiving a no-objection certificate (NoC) from the Securities and Exchange Board of India (SEBI). This approval effectively ends a nearly 9-year wait since NSE first filed its draft IPO papers in 2016.
Previously, NSE CEO Ashish Chauhan Stated that the actual listing could take place within 8-9 months after the filing, placing the IPO timeline in the second half of 2026, subject to procedural completion
With the regulatory clearance in place, NSE is now expected to file its Draft Red Herring Prospectus (DRHP) by the end of March 2026.
NSE IPO Details
The NSE IPO will be a pure offer for sale (OFS). The exchange will continue to operate with its existing cash reserves. Under SEBI’s revised rules, companies with a post-issue valuation above Rs. 5 trillion are required to dilute only 2.5% of equity initially, which implies a limited free float at listing.
Also Read:Why NSE IPO Got Delayed For So Many Years?
Currently, NSE has over 1.77 lakh shareholders, which adds complexity to the IPO, and it is expected to form a committee to manage the OFS process and ensure fair exit opportunities.
NSE IPO is expected to be one of the most closely watched market events of 2026.
In short, regulatory approval is now in place, the filing timeline is visible, and the IPO process has formally restarted after years of uncertainty.
Also read: Will NOC Effect NSE Unlisted Share?
NSE Share Price Analysis
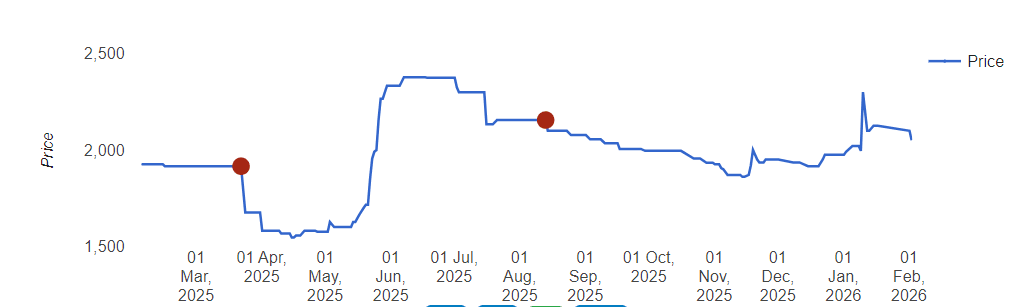
If we see the NSE shares price chart, they are currently trading around Rs. 2,050-Rs. 2,160. This reflects a sharp rise from Rs.1,000 in FY23
NSE valuation is of roughly Rs.5–5.35 lakh crore ($55–60 billion). This valuation reflects investor confidence in NSE’s dominant market position and profitability.
NSE has a strong balance sheet, with over Rs.17,000 crore in cash and cash equivalents and negligible debt.
At current prices, it trades at around 40× FY25 earnings, which is higher than global exchanges and listed peer BSE, indicating it is not cheaply valued on earnings alone.
The premium reflects NSE’s dominant position in equities and derivatives, its role as core market infrastructure, strong cash generation, and limited post IPO free float of about 2.5%.
At current levels, NSE offers a limited margin of safety. Returns are likely to be steady and long-term, driven by execution and market growth rather than sharp valuation gains.
NSE at current levels neither looks undervalued nor risky speculation. It is a strong, high-quality business priced at a premium.