Swiggy Unlisted Shares
About The Company
Strong
Market Position
Consistent
YoY Growth
Experienced
Management
Key Indicators
A snapshot of Swiggy Unlisted Shares's financial health, valuation multiples and capital efficiency at a glance.
Pricing Trends
Financial Performance
| Indicators | 2024 | 2023 | 2022 | 2021 | 2020 | 2019 | 2018 |
|---|---|---|---|---|---|---|---|
| Revenue | 11,634.3 | 5,361.3 | 6,119.8 | 2,675.9 | 3,727.7 | 1,297.3 | 0.0 |
| Expense | 13,455.4 | 8,730.2 | 9,356.0 | 3,845.6 | 7,299.6 | 3,636.9 | 0.0 |
| EBITDA | -1,821.1 | -3,368.9 | -3,236.2 | -1,169.7 | -3,571.9 | -2,339.6 | 0.0 |
| Other Cost | 529.1 | 388.7 | 391.7 | 441.9 | 336.6 | 22.2 | 0.0 |
| PBT | -2,350.2 | -3,757.6 | -3,627.9 | -1,611.6 | -3,908.5 | -2,361.8 | 0.0 |
| Tax Expense | 0.0 | 0.0 | 0.0 | 0.0 | 0.0 | 0.0 | 0.0 |
| PAT | -2,350.2 | -3,757.6 | -3,627.9 | -1,611.6 | -3,908.5 | -2,361.8 | 0.0 |
| Other Inc./Exp. | 94.2 | -13.9 | -1.0 | -5.3 | -11.9 | -1.8 | 0.0 |
| Net Income | -2,256.0 | -3,771.5 | -3,628.9 | -1,616.9 | -3,920.4 | -2,363.6 | 0.0 |
| Shares O/S | 212.30 | 17.80 | 16.40 | 0.01 | 0.01 | 0.01 | 0.00 |
| EPS (₹) | -10.70 | -211.00 | -220.70 | -1,61,690.00 | -3,84,352.90 | -2,36,360.00 | 0.00 |
| Rev. Growth % | 117.0% | -12.4% | 128.7% | -28.2% | 187.3% | — | — |
| EBITDA Mgn % | -15.7% | -62.8% | -52.9% | -43.7% | -95.8% | -180.3% | — |
| Net Mgn % | -19.4% | -70.3% | -59.3% | -60.4% | -105.2% | -182.2% | — |
| EPS Growth | -94.9% | -4.4% | -99.9% | -57.9% | 62.6% | — | — |
Registered Address
Management Team
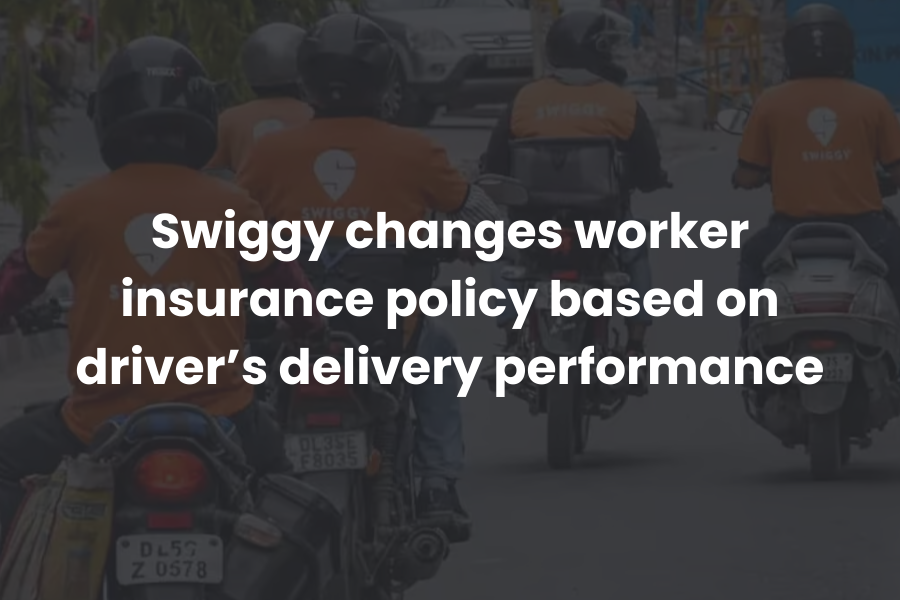
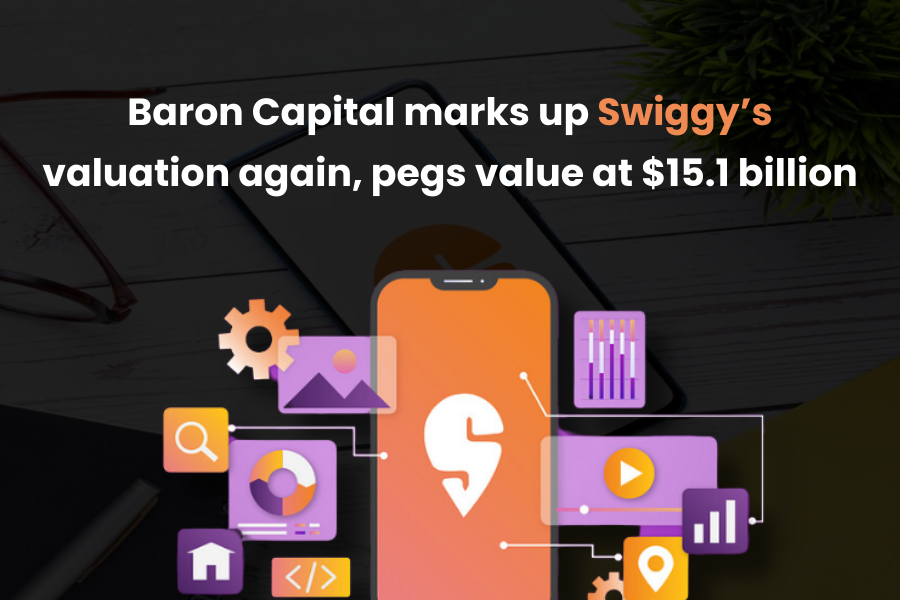
In The News


From The Experts


Top Unlisted companies


Frequently Asked Questions
Still have questions?
Our expert team typically responds within 30 minutes during market hours.
Swiggy Unlisted Shares Unlisted Shares
Bundl Technologies Private Limited (BTPL) operates under the name ‘Swiggy’. It is engaged in the business of providing food ordering and delivery services. BTPL operates a fleet of delivery personnel who pick up orders from restaurants and deliver them to customers. The company was incorporated in 2013 and has its registered office located in Bengaluru, Karnataka.
How is Swiggy Unlisted Share Price performing?
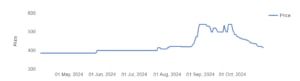
The unlisted swiggy share price was priced stably around Rs 400 per share till Aug 24.
As the IPO news got announced, Swiggy Share Price jumped to Rs 540 per share.
Currently the share is trading at Rs 462.
How To Apply For Swiggy Stock Online?
Buying and selling unlisted shares can be complex if you’re not aware of the process correctly. If you’re considering buying Swiggy Unlisted Shares and need help with how to go about it, India’s best unlisted shares broking platforms are here to help. There are many factors to consider before applying to unlisted shares, including EPS growth, KPI, EBITDA Margin, Profit & Loss summary, etc. The experts at Stockify will provide you with every valuable piece of information you need.
Check Swiggy Unlisted Share Price Today At Stockify
At Stockify, you get updated prices of Swiggy Unlisted Share Price, and the current swiggy share price is Rs. 462 per share. Keeping oneself updated with the costs of unlisted shares makes buying and selling easy. Since our experts possess a tremendous knowledge of the grey market, they update the prices whenever they get changed. So, why not log into our portal and subscribe to our newsletter for real-time updates?
Check Out Prices Of Other Unlisted Shares On Stockify
Are you interested in buying unlisted shares of other companies apart from the Swiggy? If yes, Stockify brings you a vast list of leading companies offering unlisted shares for potential investors to earn something big. You can choose the company to invest in the stock from manufacturing to healthcare, education, and energy. The companies you will find on Stockify are the best unlisted shares in India to buy. Just scroll through our list and get the updates on any unlisted company you’re looking for. For more information, we’re always here; connect with us.
Reliance Retail, Pharmeasy, Chennai Super Kings, Anglo-French Drugs & Industries, Carrier Airconditioning, Transline Technologies, GFCL EV, IGEL, Fincare Small Finance Bank Ltd Unlisted Shares, Arohan Financial Services Unlisted Shares, Utkarsh Coreinvest Ltd Unlisted Shares, Fino Paytech Ltd Unlisted Shares, Hero Fincorp Ltd Unlisted Shares, National Stock Exchange Ltd Nse Unlisted Shares, National Commodity Derivatives Exchange Ltd Ncdex Unlisted Shares, Metropolitan Stock Exchange MSEI Unlisted Shares, Capital, Small Finance Bank Ltd Unlisted Shares, and Motilal Oswal Home Finance Ltd Unlisted Shares.
