ELCID Investments Limited Shares
About The Company
Strong
Market Position
Consistent
YoY Growth
Experienced
Management
Key Indicators
A snapshot of ELCID Investments Limited Shares's financial health, valuation multiples and capital efficiency at a glance.
Pricing Trends
Financial Performance
| Indicators | 2024 | 2024 | 2024 | 2024 | 2024 | 2024 | 2024 | 2024 | 2024 | 2024 | 2024 | 2023 | 2022 | 2021 | 2020 | 2019 | 2018 |
|---|---|---|---|---|---|---|---|---|---|---|---|---|---|---|---|---|---|
| Revenue | 0.0 | 0.0 | 0.0 | 0.0 | 0.0 | 0.0 | 0.0 | 0.0 | 0.0 | 0.0 | 0.0 | 108.9 | 134.8 | 107.7 | 77.5 | 60.9 | 47.6 |
| Expense | 0.0 | 0.0 | 0.0 | 0.0 | 0.0 | 0.0 | 0.0 | 0.0 | 0.0 | 0.0 | 0.0 | 6.1 | 0.9 | 0.9 | 5.8 | 1.6 | 0.7 |
| EBITDA | 0.0 | 0.0 | 0.0 | 0.0 | 0.0 | 0.0 | 0.0 | 0.0 | 0.0 | 0.0 | 0.0 | 102.8 | 133.9 | 106.8 | 71.7 | 59.3 | 46.9 |
| Other Cost | 0.0 | 0.0 | 0.0 | 0.0 | 0.0 | 0.0 | 0.0 | 0.0 | 0.0 | 0.0 | 0.0 | 0.8 | 2.8 | 0.3 | 0.2 | 0.2 | 0.2 |
| PBT | 0.0 | 0.0 | 0.0 | 0.0 | 0.0 | 0.0 | 0.0 | 0.0 | 0.0 | 0.0 | 0.0 | 102.0 | 131.1 | 106.5 | 71.5 | 59.1 | 46.7 |
| Tax Expense | 0.0 | 0.0 | 0.0 | 0.0 | 0.0 | 0.0 | 0.0 | 0.0 | 0.0 | 0.0 | 0.0 | 28.6 | 31.0 | 25.5 | -1.7 | 4.5 | 0.3 |
| PAT | 0.0 | 0.0 | 0.0 | 0.0 | 0.0 | 0.0 | 0.0 | 0.0 | 0.0 | 0.0 | 0.0 | 73.4 | 100.0 | 81.0 | 73.2 | 54.5 | 46.4 |
| Other Inc./Exp. | 0.0 | 0.0 | 0.0 | 0.0 | 0.0 | 0.0 | 0.0 | 0.0 | 0.0 | 0.0 | 0.0 | 0.0 | 0.0 | 0.0 | 0.0 | 0.0 | 0.0 |
| Net Income | 0.0 | 0.0 | 0.0 | 0.0 | 0.0 | 0.0 | 0.0 | 0.0 | 0.0 | 0.0 | 0.0 | 73.4 | 100.0 | 81.0 | 73.2 | 54.5 | 46.4 |
| Shares O/S | 0.00 | 0.00 | 0.00 | 0.00 | 0.00 | 0.00 | 0.00 | 0.00 | 0.00 | 0.00 | 0.00 | 0.02 | 0.02 | 0.02 | 0.02 | 0.02 | 0.02 |
| EPS (₹) | 0.00 | 0.00 | 0.00 | 0.00 | 0.00 | 0.00 | 0.00 | 0.00 | 0.00 | 0.00 | 0.00 | 3,670.60 | 5,001.90 | 4,052.50 | 3,659.00 | 1,918.10 | 2,315.70 |
| Rev. Growth % | — | — | — | — | — | — | — | — | — | — | — | -19.2% | 25.2% | 39.0% | 27.3% | 27.9% | — |
| EBITDA Mgn % | — | — | — | — | — | — | — | — | — | — | — | 94.4% | 99.3% | 99.2% | 92.5% | 97.4% | 98.5% |
| Net Mgn % | — | — | — | — | — | — | — | — | — | — | — | 67.4% | 74.2% | 75.2% | 94.5% | 89.5% | 97.5% |
| EPS Growth | — | — | — | — | — | — | — | — | — | — | — | -26.6% | 23.4% | 10.8% | 90.8% | -17.2% | — |
Registered Address
Management Team
Download Financial Results
In The News


Top Unlisted companies


Frequently Asked Questions
Still have questions?
Our expert team typically responds within 30 minutes during market hours.
Buy Elcid investments share
Established on December 3, 1981, under the provisions of the Companies Act 1956 in Mumbai, Elcid Investment Limited is a Non-Banking Finance Company registered with the Reserve Bank of India. The company does most of its business by investing in stocks, debentures, and mutual funds. Its primary source of income is dividends and appreciation in the share price. Elcid Investment Limited unlisted shares hold a total of 2,83,13,860 Asian Paints shares, which were worth Rs. 9830 crores on October 3, 2022. Further, the per-share value of this investment is worth Rs. 4,70,000. The shares of Elcid Investment Limited are available to trade in the unlisted share market.
ELCID Investment Limited is a non-banking finance company that has been around the business since 1981. It deals in making investments in shares, mutual funds, debentures etc. ELCID is also a stakeholder in the Indian paint company Asian Paints. Moreover, it has been generating good revenue and its share prices are also staying consistent.
Why Buy Elcid Investment Limited Unlisted Shares?
In FY22, Elcid Investment Limited company announced that its total revenue increased by 25%, to Rs. 134 crores from Rs. 107 crore in the previous financial year. Further, the net profit of the company also increased by 23%, which is Rs. 100 crores as against Rs. 81 crores in the previous year. So, the data clearly suggests that Elcid Investment Limited unlisted shares are a worthy investment.
ELCID Investment’s unlisted share prices have been quite stagnant for the last few years. In the last 3 years, there has only been a 6% dip in the shares. At the beginning of this year, the share price of ELCID Investment was around ₹1,49,000 which has increased by ₹800 to ₹1,49,800 in December 2023. This shows that the share price is on its way up. One of the major problems with ELCID is that there is little to no liquidity for its shares, but buying unlisted shares from Stockify gives you liquidity as Stockify has a buy-back scheme where it will buy shares from sellers at the market price.
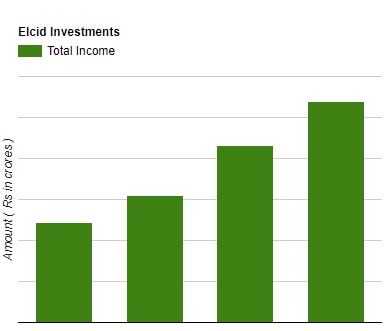
Check out the financial highlights of the company, (Rs. in Crores)
Particulars | 2021-22 | 2020-21 | 2019-20 | 2018-19 |
Total income | 135 | 108 | 78 | 61 |
PAT | 100 | 81 | 73 | 55 |
Basis and Diluted EPS | 5001.94 | 4052.46 | 3659.01 | 2727.19 |
Book value per share | 616440 | 508261 | 347598 | 256673 |
Equity | 12329 | 10165 | 6952 | 5133 |
How To Apply For Elcid Investment Limited Unlisted Shares Online?
If you want to buy Elcid Investment Limited unlisted shares India, Stockify is an ideal platform for you. From key performance indicators to revenue growth, EBITDA margin reports, EPS growth, and other information, we give you a detailed report of a Pre-IPO company under a roof. Now buying Elcid Investment Limited unlisted shares is quite easy with Stockify. After going through the information mentioned above, you can determine your requirements, and our experts will assist you throughout the process.
ELCID Investment is one of the best-unlisted shares available on the market right now. Moreover, it has a bright future which is reflected by its financial performance in recent years. In the Fiscal year 2021-2022, the company generated a revenue of ₹134.8 crore while its PAT was around ₹100 crore. However, in fiscal year 2022-2023, the revenue generated by the company was ₹108.9 crore and a PAT of ₹73 crore.
Check Elcid Investment Limited Unlisted Share Price Today At Stockify
To check Elcid Investment Limited unlisted share price, Stockify is the right place. If you’re planning to buy and sell Elcid Investment Limited unlisted shares in India, stay tuned with Stockify to check live share prices. Our experts always keep a keen eye on market trends and fluctuations in Elcid Investment Limited company share prices and update the prices regularly. The current price of Elcid Investment Limited unlisted shares is Rs. 156,000.0.
Check Out Prices Of Other Unlisted Shares On Stockify
There are many ways people can get high ROI, but one golden way is to invest in unlisted shares. Investing in unlisted shares helps you diversify your investment portfolio and ensures you a high return on investment. Stockify brings you a huge collection of profitable pre-IPO shares of top companies in India. Just check out the list now.
Reliance retail, Pharmeasy, Chennai super kings, Anglo-French Drugs & Industries, Maverick Simulation Solutions, PL Capital Market Unlisted Shares, Goodluck Defence Unlisted Shares, Fincare Small Finance Bank Ltd Unlisted Shares, Arohan Financial Services Unlisted Shares, Utkarsh Coreinvest Ltd Unlisted Shares, Fino Paytech Ltd Unlisted Shares, Hero Fincorp Ltd Unlisted Shares, National Stock Exchange Ltd Nse Unlisted Shares, National Commodity Derivatives Exchange Ltd Ncdex Unlisted Shares, MetroPolitan Stock Exchange MSEI Unlisted Shares, Capital, Small Finance Bank Ltd Unlisted Shares, And Motilal Oswal Home Finance Ltd Unlisted Shares.
